
The stock market isn’t a casino, but investors must know how to stack the odds in their favour
Investing shouldn’t feel like gambling, but there are several key statistical tools that can help you beat the odds.

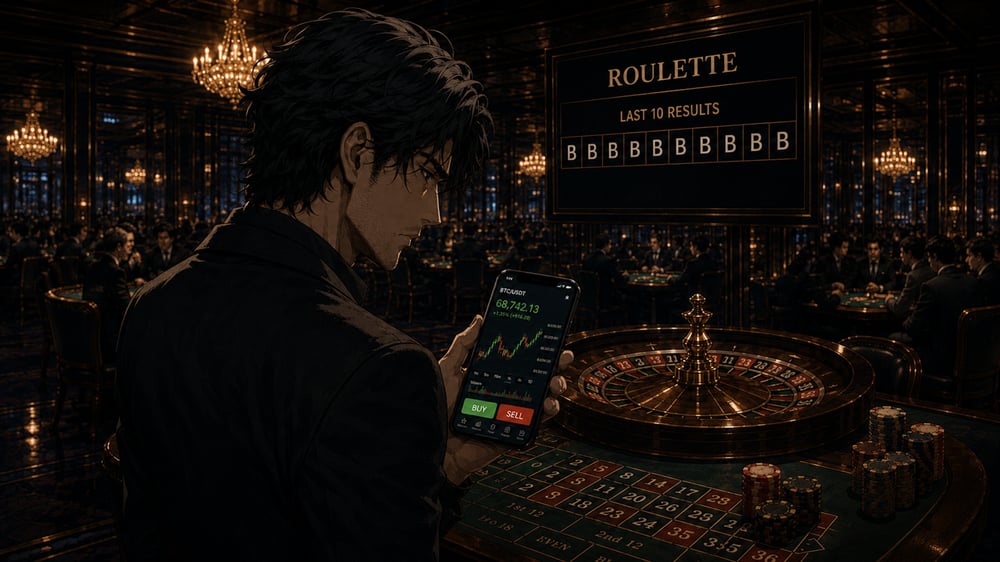
Source: ChatGPT 5.5
KEY POINTS
- Investors tell themselves that they can beat the market, that their investing mythology is sound, but there’s far more to long term investing success than simply picking stocks.
- What actually separates long-term winners from everyone else isn't which stocks they buy – it's how much they risk on each trade, and how ruthlessly they cut losses before one bad call wipes out months of gains.
- This article will challenge your view on trading and investing, show you the critical equation that professionals use to build long term wealth, and outline critical risk management principles.
The image attached to this article looks like a casino scene, but the point is not that trading and investing is gambling. The point is that many behave as if it isn’t.
Sure, the average trader or investor very likely doesn’t sit at a roulette table, phone in hand, conducting their business! But the choice facing both them and the gambler is similar: buy or sell, bet or refrain?
Where the analogy is perhaps most powerful, is the roulette board shows the last 10 spins have all landed on black. To a novice, that streak feels meaningful.
Surely red is “due”. Or perhaps black has momentum. Either way, the mind starts building a story. It reaches for a pattern. It wants to believe that the next outcome can be solved.
As humans, we can’t help but find patterns even in the most random of outcomes. Many of us mistake a pattern we’ve stumbled across as “expertise”.
A technical analyst might assume that if the last 10 candles were long and white that the stock must be due for a pullback – or if they were long and black that bargain hunters must surely be about to step in. Fundamentals-focused investors might reason that a strong result means the stock must be headed higher.
Whatever narrative you’ve chosen to convince yourself that your next course of action is correct, the next print on the screen is unknowable.
That doesn’t mean markets are perfectly random in every respect. Nor does it mean that analysis is useless. It means the next tiny unit of price movement – the next bid, offer, trade or candle – is beyond our control or ability to consistently predict.
No person, algorithm or AI can know the next print with certainty. Even if a large player tried to manufacture the next price movement, another order could arrive first. Liquidity can shift. News can drop. A seller can appear. A buyer can vanish.
Arriving at the conclusion that prediction is futile can be daunting. We crave certainty, particularly with our money. But It can also be liberating. Because if the next outcome is unknowable, the dynamics of capital allocation change. The job is not to predict perfectly, the job is to manage what happens next.
This is a major psychological shift. Most believe success comes from finding the perfect reason to buy or sell. The chart pattern. The valuation gap. Your broker’s advice. The hot tip. AI’s analysis. The secret formula.
But in practice, success or failure often comes down to something far less glamorous: What did you do after you entered?
When a position moved against you, did you cut the loss while it was still small? Or did you hold, rationalise, average down, and wait until the loss became too large and painful to deal with?
When a position moved in your favour, did you nervously smash the sell button to lock in a quick profit? Or did you do the uncomfortable thing and give the position enough room to become a genuinely meaningful winner?
What is expectancy and why is it so important?
This is where expectancy comes in. Expectancy is the average amount one can expect to make or lose per trade over time. It combines how often you win with how much you win when you are right, and how much you lose when you are wrong.
The formula is:
Expectancy = (Win rate × Average win) – (Loss rate × Average loss)
For example, imagine a stock investor takes 100 trades. They win 40% of the time and have an average win of 20%, while their average loss is limited to 10%. On the surface, that sounds poor, losing more often than not. This is because most beginners assume that success equates to accuracy, that picking the right stocks is the key.
The investor’s expectancy is:
(40% × 20%) – (60% × 10%)
= 8% – 6%
= +2% per trade
Despite being wrong six times out of 10, this system has positive expectancy because the winners were sufficiently bigger than the losers to more than account for the 40% strike rate.
Now compare that with someone who wins 70% of the time but takes quick profits and lets losers run. Assume their average win is 5%, while their average loss is 15%.
Their expectancy is:
(70% × 5%) – (30% × 15%)
= 3.5% – 4.5%
= -1% per trade
This trader is right far more often than they are wrong, but the strategy still loses money over time. That is one of the hardest lessons in markets: being right is not the same as being successful. The difference is not ego. It is maths.
💡 Key takeaway: Do you know your expectancy? You should. Review your last 12 months of trades and calculate your win rate, average win and average loss. Then plug them into the expectancy equation to see whether your current strategy is profitable – that is, whether it has a positive expectancy.
It’s not “don’t lose”, it’s “don’t lose everything”!
Cut your losses short and let your winners run. It’s one of the oldest adages in markets. Wins are the goal, but losses are inevitable – this is why limiting them matters so much.
A “drawdown” is what professionals define as the percentage fall from a portfolio’s peak value to its trough. If a portfolio falls from $100,000 to $80,000, that’s a 20% drawdown.
The trap is that the gain required to recover is always larger than the drawdown suffered. Consider that a 10% drawdown needs an 11.1% gain to recover, 20% requires 25%, 50% requires 100%, and 100% requires, well, infinity! There’s no capital left to make the next bet.
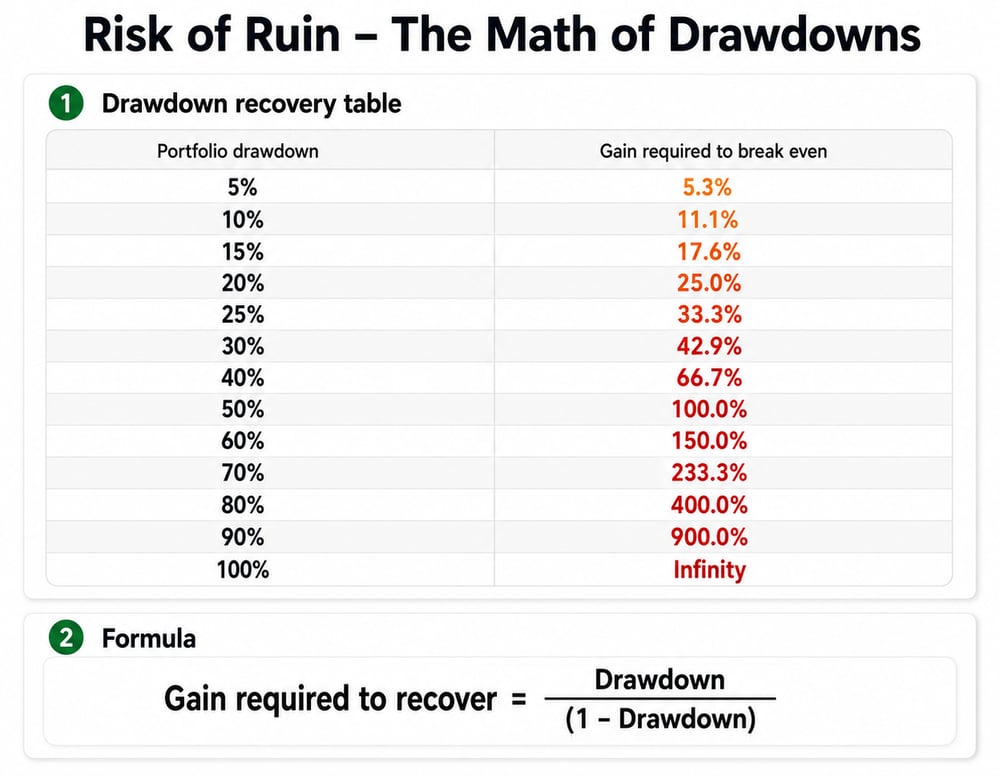
Risk of ruin table
That is why large losses are so destructive. They don’t just hurt one’s account balance – they can damage one’s ability to remain in the game.
Once the drawdown becomes large enough, the problem is no longer analytical. It becomes emotional. The trader freezes. They stop following their process. They become desperate to “make it back” at all costs. They take oversized risks at exactly the wrong time.
This is the real risk of ruin: reaching a point where the financial and psychological damage is so severe that rational decision-making breaks down. We don’t make good decisions when we’re emotional, and few things make us more emotional than losing a pile of dough!
Picking the best stocks (isn’t the most important bit!)
The roulette board in our starting image is useful because it exposes the “analysis illusion”. Ten blacks in a row feels like information. Making a decision on that information feels like sound analysis. It begs the reader to make a prediction.
Indeed, too many look at the information in front of them and infer “what happens next?” – when the better question is “how much should I risk and what will I do if I am wrong?” That’s the difference between prediction and process.
Process is bigger than simply picking stocks: it also incorporates risk management and capital preservation.
Your method might be technical, fundamental, quantitative, based on broker research, or driven by machine learning or AI. Whichever – long-term success is usually determined by non-methodological factors like position sizing, drawdown management, patience, discipline, emotional regulation, and the ability to let winners do their work.
Method matters, but it's not enough. To show just how little stock picking contributes to a winning strategy – and how much risk management does – I ran 100 backtest simulations over 20 years across a past-and-present ASX 300 universe. That means companies that later went bankrupt, were acquired, or otherwise fell out of the index are included – avoiding the survivorship bias that would otherwise flatter a backtest built only on today's winners.
The system had no stock-picking intelligence. It randomly chose whether to buy or short eligible stocks, subject only to a basic liquidity filter. In each simulation, the portfolio could hold up to 20 positions at a time, with each trade sized at 5% of portfolio equity. Each trade was then managed with a fixed 20% profit target and a 10% stop loss.
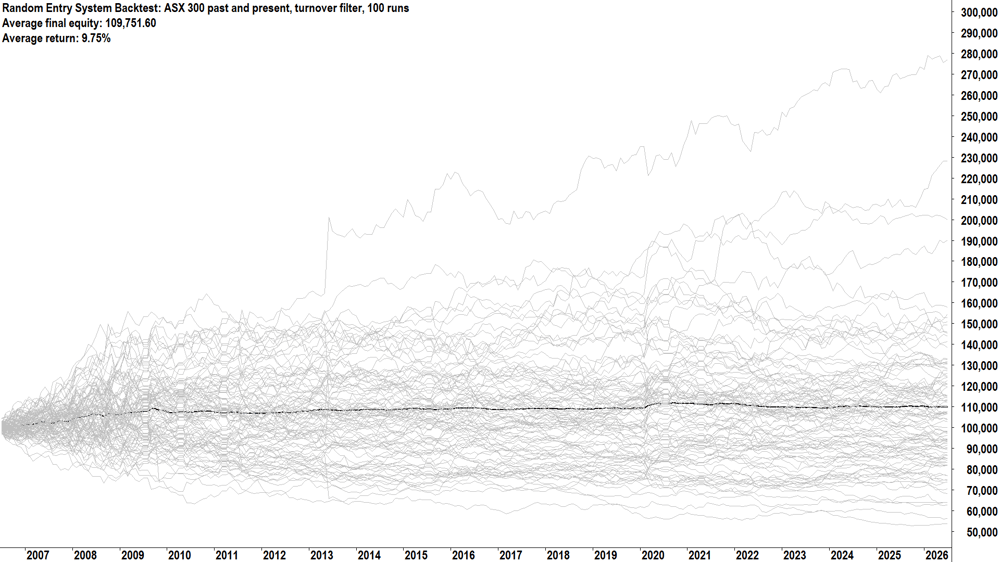
100 simulation random entry system backtest equity curves. Each equity curve represents the running portfolio balance of one simulation. The starting balance for each simulation is $100,000. The bold black line is the average result. For each trade, the model randomly went long / short and then held until either at 20% profit or a 10% loss. A maximum of 20 trades was allowed with each trade starting at 5% portfolio equity. A turnover filter was applied, requiring each stock to have a minimum $250k average daily turnover during the prior month. Simulation conducted on Amibroker using Norgate Data.
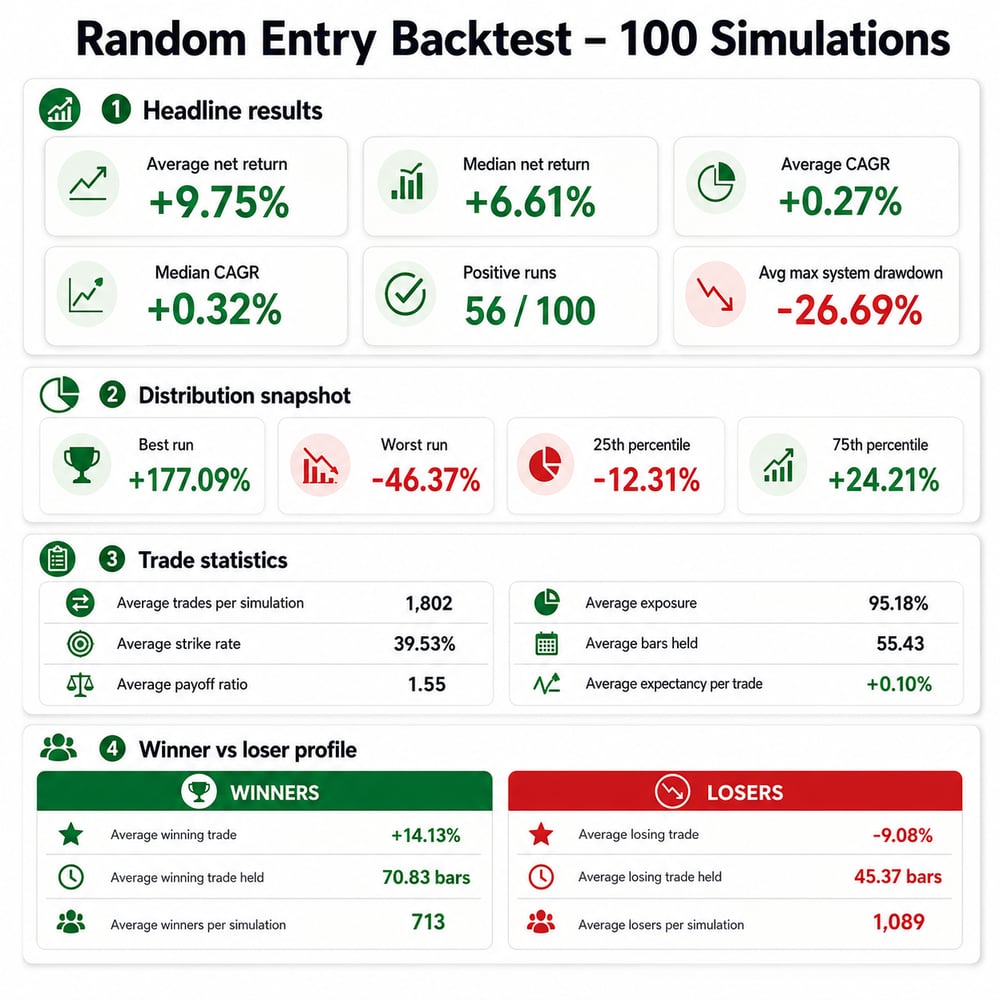
Across the 100 simulations, the average return was +9.75%, with a median return of +6.61%. The average compound annual growth rate (CAGR) was just 0.27% p.a., with a median CAGR of 0.32% p.a. That’s not impressive. It didn’t beat the market. It’s not something anyone should copy. But that’s not the point.
GFC, European Debt Crisis, COVID, Russia-Ukraine, Trump’s tariffs and war with Iran, it’s all in the 20-year lookback... Some of the toughest markets, versus random entries – with no stock picking ability – and yet the process didn’t collapse.
The system won only 39.5% of the time, but because the average winner was +14.13% and the average loser was -9.08%, the average expectancy still came in slightly positive at +0.10% per trade. Most importantly, the modest edge the system displayed didn’t come from prediction – it came from structure.
Critically:
Losses were capped and winners were given twice as much room to move.
No single position was allowed to dominate the portfolio.
The method of stock selection was emotionless and methodical – it never asked, “What if the stock bounces, maybe I should hold on?”
Embrace uncertainty, focus on process
The market will never give you certainty. The next print will always carry an element of randomness. Our edge comes from accepting that uncertainty, then building a process that survives it.
I have demonstrated how a purely random stock picking model didn't lose money over 20 years of arguably some of the most volatile markets in modern history. Improving on its baseline – to push that 0.27% p.a. return beyond the corresponding market return – is the real challenge traders and investors face.
One thing is certain, regardless of which method you choose: sound risk and drawdown management must be part of your process.
💡Key takeaway: Learn more about risk management — including cutting losses, letting profits run, and managing drawdowns — in my ChartWatch *LIVE* webinars. You can join live each Wednesday at lunchtime by registering here, or you can watch any of the webinar recordings on Market Index’s YouTube page.
