
The ASX is flat, so why does it feel like a bear market?
Flat on the surface, a stealth bear market underneath. 71% of All Ords stocks sit more than 20% below their 52-week highs.

.jpg)
Source: Shutterstock
KEY POINTS
- 71% of All Ords stocks are more than 20% below their 52-week highs. The median stock is down 12.5% over 12 months, versus a 3.9% cap-weighted gain.
- The smaller the stock, the deeper the selloff. 91% of stocks under $300 million are more than 20% off their 52-week highs, versus 27% of those above $10 billion.
- Leadership has turned defensive. Seven of the 19 stocks within 5% of their 52-week highs are financials, while median energy and materials stocks fell around 12–13% over the past month.
The ASX 200 has traded effectively flat over the past month and is around breakeven year-to-date. So why do things feel so painful?
Looking at the major benchmarks, the smaller you go, the worse it gets.
The All Ords (500 largest companies) is still cap-weighted, so large cap outperformance masks small cap struggles. It’s down 1.1% YTD
The ASX Small Ords (companies ranked 101 to 300) is down 11% YTD, back at March and late-July levels, which coincided with the onset of the US-Iran war and the initial tech pullback
The ASX Emerging Companies index (microcaps outside the ASX 300) is on life support, down 15% YTD and trading at its lowest since May 2025
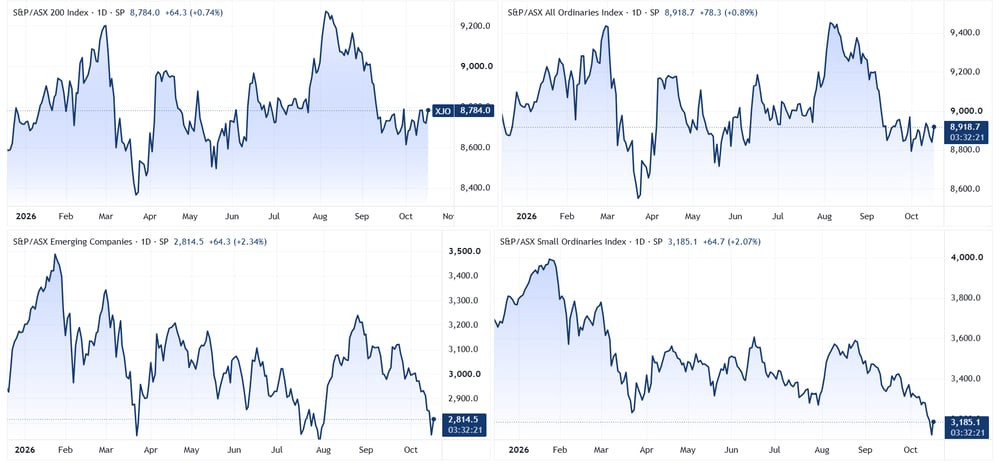
ASX 200 (top left), All Ords (top right), Emerging Companies (bottom left) and Small Ords (bottom right) | Source: TradingView
A stealth bear market
Beneath the indices, things are far worse than they seem. The chart below shows the share of All Ords constituents in each sector trading below their 52-week highs, as at the close on Thursday, 15 October.
At a glance:
71% of All Ords stocks are more than 20% below their 52-week high, but those stocks make up only 30% of market cap
The median stock is down 12.5% over the past 12 months, while the cap-weighted return is +3.9%
Only about one in five stocks are trading above their 50-day moving average, and 28.8% are above their 200-day
The selling has accelerated, where 71% of stocks fell over the past month, with a median move of −5.2%
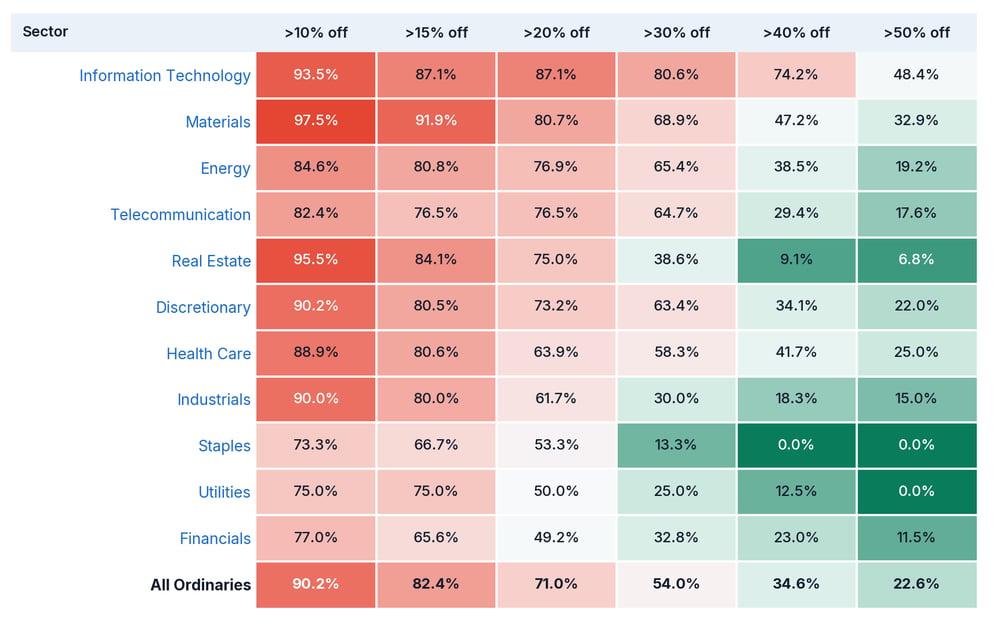
Data as at close 15 October 2026 | Source: Market Index
While there are no doubt plenty of nuggets in the small cap space, in aggregate, the smaller the stock, the deeper the bear market.
The chart below groups All Ords constituents by market cap. Of stocks valued under $300 million, 91% are more than 20% below their 52-week high and only 9% trade above their 200-day moving average. Among large caps (over $10 billion), just 27% are more than 20% off their 52-week high and 57% are above their 200-day.
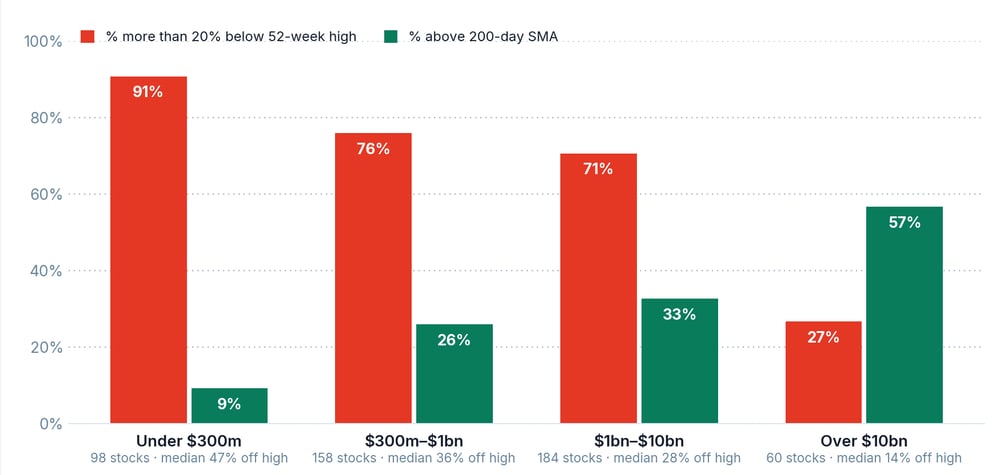
Data as at close 15 October 2026 | Source: Market Index
Another way to look at it is how far stocks sit below their 52-week highs, split by size. For simplicity, we’ve divided the market into companies above and below $1 billion in market cap. Each bar shows how many stocks fall within a 5% band.
Large caps cluster around the bear-market line, most commonly 15–20% off their highs. Small caps peak well past it, with the median sitting 39% below its 52-week high.
At a glance:
More than four in five small caps (82%) are past the 20% line
The deep tail belongs almost entirely to small caps. Of the 63 stocks more than 60% off their highs, 55 (87%) are under $1 billion
The left side of the chart is mostly large caps. Of the 49 stocks within 10% of their highs, 36 (73%) are worth $1 billion or more
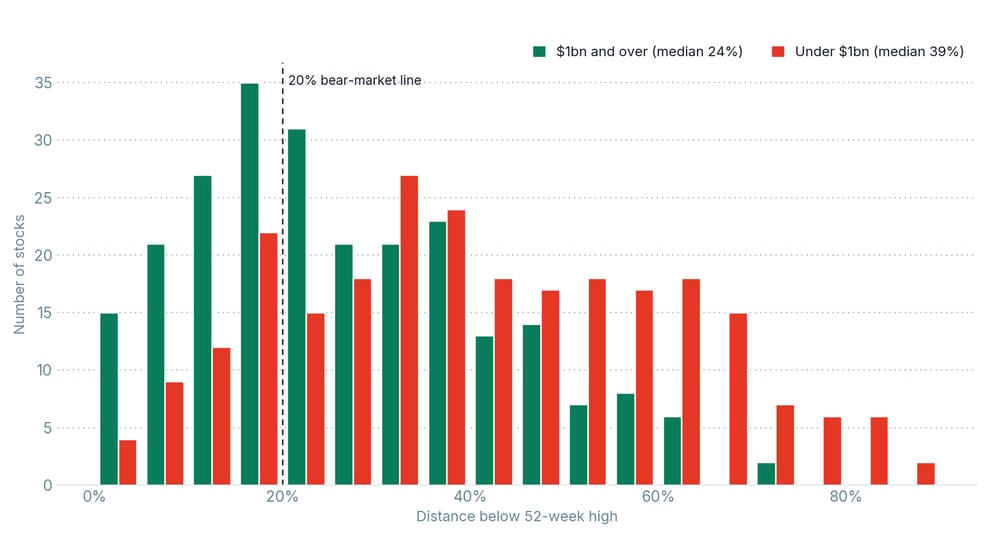
Data as at close 15 October 2026 | Source: Market Index
Getting big and defensive
The data suggests market leadership has shifted from resources to something far more defensive. Of the 19 stocks within 5% of their 52-week highs:
Seven are Financials, led by insurers Suncorp, IAG and QBE, plus ASX and ANZ Group
Two are staples, Woolworths and Coles
One is a utility, APA Group
Three are healthcare names: Ramsay Health Care, Fisher & Paykel Healthcare and Ansell
Energy and materials were all the rage in recent months, but the median stock in each sector has fallen around 12–13% over the past month. Over the same period, the median staples and utilities stocks have crept 3.2% and 1.0% higher, respectively.
So while the ASX 200 may look flat, there's a lot of pain beneath the surface and absolute carnage towards the small end.
