
S&P 500 flashes dot-com style rotation as staples surge, tech tumbles
The S&P 500 is showing rare divergences last seen in 2000, but mega-cap tech concentration may be creating a new market playbook.

Source: iStock
KEY POINTS
- The S&P 500 Consumer Staples sector rallied over 1% for two consecutive days while Tech fell at least 1% both days, a pattern only seen once before in 2000.
- Market bifurcation shows 16% of stocks at 52-week highs and 5% at lows, a setup that preceded 10% corrections in 1990, 2015 and March 2025.
- Value-oriented sectors are forecast to grow just 6.4% in 2026 compared to 27% for growth sectors, limiting the runway for sustained defensive outperformance.
The US market has flagged a decisive rotation in recent days, with the Equal-weight S&P 500 closing at fresh all-time highs on Wednesday while the cap-weighted index sits around 1.5% below recent highs.
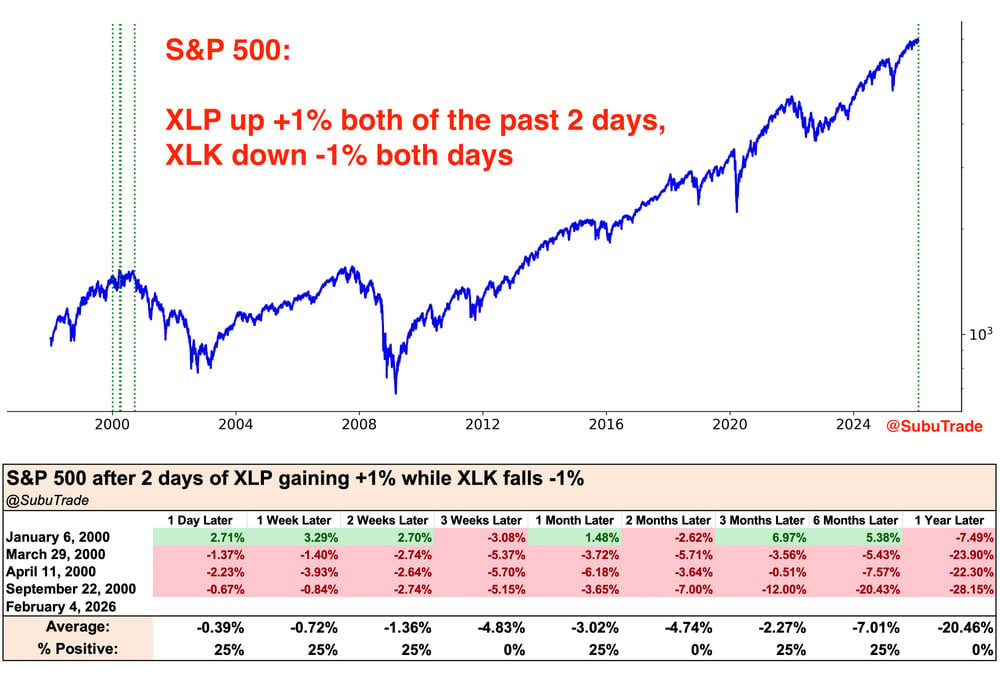
One of the clearest indications of this rotation is how the S&P 500 Consumer Staples sector has rallied more than 1% over the last two sessions, while the Tech sector finished at least 1% lower on both days.
The rush into Staples has been as dramatic as the headline-grabbing tech selloff. The S&P 500 Consumer Staples sector now has a 14-day RSI of 84.2, a level of overbought conditions not seen since 1995.
This two-day rotation has only happened once before, in 2000 right before the dot-com bust, according to SubuTrade.
Source: @SubuTrade
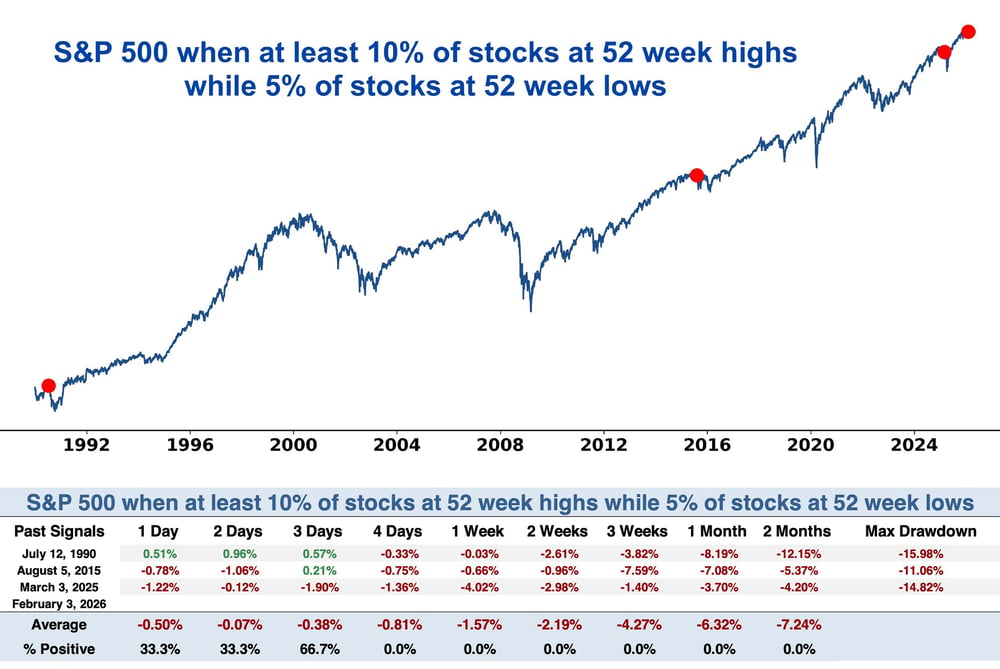
The market is also highly bifurcated, with 16% of S&P 500 stocks trading at 52-week highs while 5% are at 52-week lows. X user @TheMarketStats notes this has only happened three other times: July 1990, August 2015 and March 2025. Each instance was followed by a correction of at least 10% for the S&P 500 within two months.
Source: The Market Stats
While the precedent has been overwhelmingly bearish, SubuTrade flagged another data point worth considering.
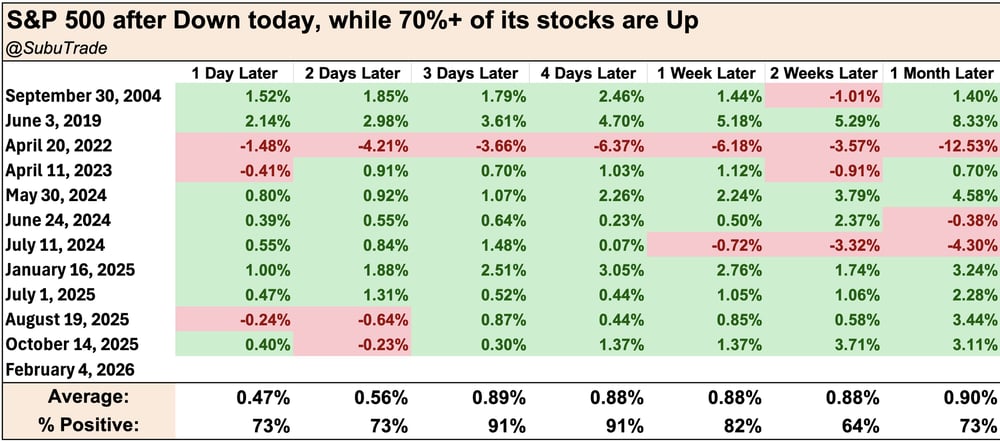
On Wednesday, the S&P 500 finished 0.51% lower but more than 70% of its constituents closed in positive territory. This bullish breadth divergence has only occurred 11 times in history, most within the last four years. In ten of those instances, the S&P 500 rallied 3-4 days later.
Source: @SubuTrade
The increasingly large weighting of tech has made this more common – days where tech falls while almost everything else is higher.
The bottom line
The concentration of the S&P 500 in mega-cap tech stocks means these divergences may become more frequent, which partly explains why the only historical precedent dates back to the dot-com bubble. This suggests that sustained breadth deterioration and credit stress may be necessary before the dot-com comparisons become truly alarming.
While a broadening rally is generally positive, there's a key difference between a move driven by large-scale capital rotation and one supported by genuine fundamentals. As Bloomberg noted, the main constraint for sustained defensive outperformance is earnings. Value-oriented sectors are forecast to grow 6.4% in 2026, compared to a 27% increase for growth-related sectors.
