
Morning wrap explainer: Understanding stock indices, yields and commodities
Learn how to read stock indexes, commodities and yields to gauge overnight market sentiment and ASX sector moves.

Source: Shutterstock
Every morning, millions of Australian investors wake up to check the overnight performance of the S&P 500, Nasdaq, Dow and a few other numbers. This provides us with a sense check of how markets are performing and what to look forward to.
Our Morning Wrap features a recurring 'Overnight Summary' table that covers major global indices as well as the price of key commodities, currency, crypto and bond yields. There's a lot of numbers but hopefully, after reading this, you'll know what they are and why it matters.
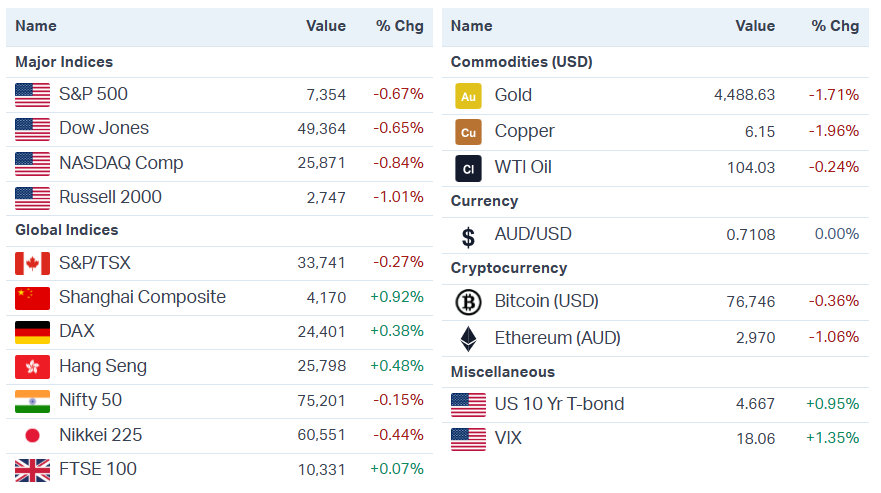
Morning Wrap 'Overnight Summary' table (Source: Market Index)
S&P 500
What is it: The S&P 500 is an index of 500 large US companies listed on major exchanges like the NYSE, Nasdaq and Cboe. To be eligible, a company must have a market cap of at least ~$22 billion, be headquartered in the US, and report positive earnings in its most recent quarter as well as a positive sum across the trailing four quarters. Eligible companies are then selected by a committee rather than added automatically. The index is weighted by float-adjusted market cap, which counts only shares available for public trading and excludes closely-held stakes like those owned by insiders or governments.
Why it matters: The S&P 500 is the world's most widely followed equity benchmark, serving as the primary gauge for US stock market performance and a key signal of global investor sentiment. When the S&P 500 moves, it often sets the tone for markets worldwide. Home to mega-cap tech giants like Apple, Microsoft, Nvidia and Amazon, the index covers roughly 80% of total US equity market capitalisation, making it a critical barometer for institutional investors, fund managers and traders globally.
Talking numbers: Since 2009, the ASX 200 (absolute not total return) has a ~0.3 correlation vs. the S&P 500. On a scale of -1 (perfect negative correlation) to +1 (perfect positive correlation), 0.3 is considered a relatively weak correlation. It's not strong enough to say the indices move closely together, but it's not so weak as to suggest no relationship at all.
Nasdaq Composite
What is it: The Nasdaq is an index of more than 3,000 companies listed on the Nasdaq Exchange. Like the S&P 500 (and unlike the Dow), it weights constituents by market cap, but it's heavily skewed towards tech, which accounts for more than half of the index's total value.
Why it matters: The Nasdaq serves as a key gauge for tech sector sentiment and broader risk appetite. Its heavy concentration in growth and technology stocks makes it more volatile than broader indices, often experiencing greater moves in both directions. When investors are chasing growth, the Nasdaq typically leads the market higher; when bearishness takes hold, it tends to fall harder and faster. That makes it a useful real-time read on whether investors are positioned aggressively or defensively.
Dow Jones Industrial Average
What is it: The Dow is a collection of 30 major US "blue chip" stocks, including household names like Microsoft, JPMorgan and McDonald's. The Dow is price-weighted, meaning stocks with higher share prices have more influence on the index.
Why it matters: The Dow is one of the oldest and most widely watched market indices. It skews toward established, economically significant companies rather than high-growth names, giving it a reputation as a barometer for established corporate America. While it tracks only 30 stocks, those constituents are large, mature businesses that collectively reflect broad market sentiment and economic conditions.
A solid proxy for the ASX: As of December 2025, the Dow's top sectors include Financials (27.8%), Tech (20.7%), Industrials (14.8%), Discretionary (12.2%) and Healthcare (12.0%). That makes it loosely comparable to the ASX 200, which is dominated by Financials and Materials.
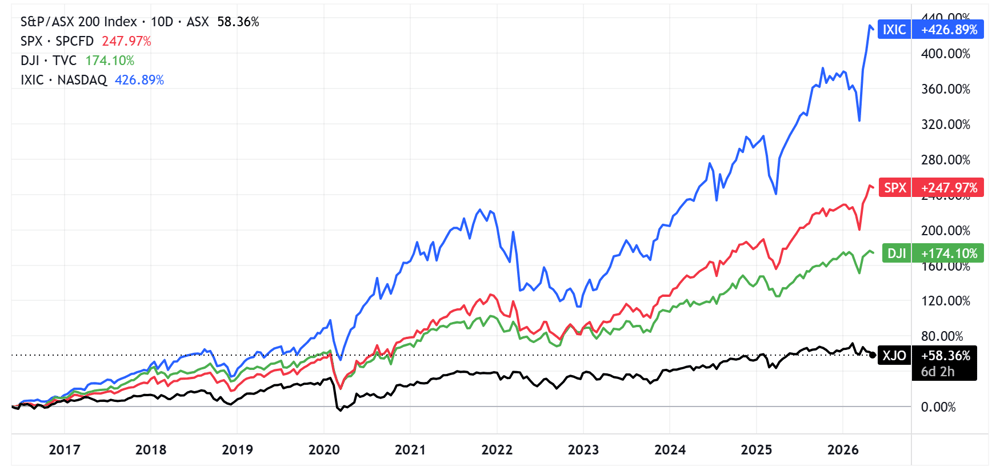
ASX 200 (black) vs. Dow (green), S&P 500 (red) and Nasdaq (blue) | Source: TradingView)
Russell 2000
What is it: The Russell 2000 is a stock market index that measures the performance of around 2,000 small-cap US companies. It's market-cap weighted and, as of 2026, reconstituted semi-annually (previously annually each June). Its largest sector weightings are typically Financials, Industrials and Healthcare, with notably lower exposure to mega-cap tech than the S&P 500 or Nasdaq.
Why it matters: The Russell 2000 is the definitive benchmark for US small-cap performance and often serves as a more sensitive barometer for both risk appetite and domestic economic health. These small caps generate the bulk of their revenue in the US, so they're closely tied to local conditions. When the Russell outperforms large caps, it often signals investors are optimistic about economic growth and willing to take on more risk.
US 10-Year Yield
What is it: The US 10-year Treasury note is a debt instrument issued by the US government to finance its operations, with a maturity of 10 years. It's widely viewed as the world's premier safe-haven asset and the benchmark for global interest rates. The yield represents the annual return investors receive for lending money to the US government, and it moves inversely to the bond's price (when demand for the bond rises, prices go up and yields fall, and vice versa).
Why it matters: The 10-year yield is the most closely watched number in global finance, serving as the baseline for virtually all other interest rates. When yields rise, it signals either stronger economic growth expectations or increased inflation concerns, both of which make bonds more attractive relative to riskier assets. Higher yields increase borrowing costs across the economy (mortgages, corporate debt, consumer loans) and make future corporate earnings less valuable in present-day terms, which pressures stock valuations, particularly for growth and tech stocks that rely on distant future cash flows.
When yields surged: The 10-year yield surged from 1.5% in late 2021 to a peak of 4.9% in October 2023. This was largely due to a sudden spike in inflation, with US CPI reaching a 40-year high of 9.1% in June 2022. During this period, the S&P 500 fell as much as ~25% between December 2021 and October 2022, and didn't recover those declines until December 2023.
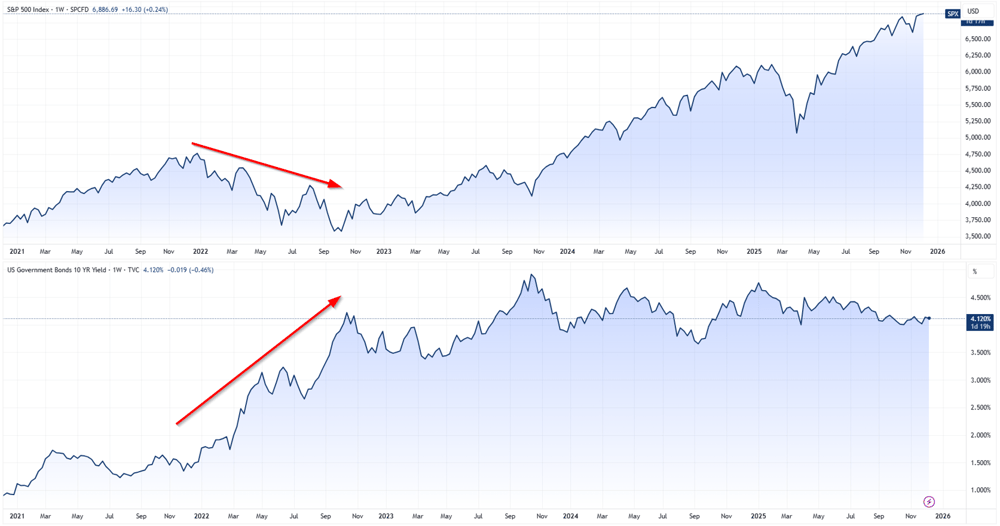
S&P 500 vs. US 10-year yield (Source: TradingView)
VIX Index
What is it: The VIX, commonly known as the "fear index," measures the market's expectation of volatility over the next 30 days. It's calculated using the prices of S&P 500 options, specifically capturing how much traders are willing to pay for protection against market swings. The VIX moves inversely to the stock market: when stocks fall sharply, the VIX typically spikes as investors scramble for hedges.
Why it matters: The VIX serves as Wall Street's primary fear gauge, spiking during market turmoil and declining during calm periods. A rising VIX often precedes or accompanies sharp equity selloffs, while a falling VIX suggests investors are confident and risk appetite is strong. Extended periods of low VIX readings can signal dangerous complacency, often preceding sudden volatility events.
Talking numbers: The VIX is expressed in percentage points and represents annualised expected volatility. A VIX of 20 translates to an expected S&P 500 movement of roughly 5.8% (up or down) over the next 30 days. Readings below 15 typically indicate market complacency, 15-20 represents normal conditions, 20-30 suggests elevated concern, and above 30 signals high anxiety or crisis mode. During major market events like the 2008 financial crisis or March 2020 pandemic panic, the VIX has spiked above 80.
Other benchmarks
The Morning Wrap features several other international benchmarks under "Country Indices". These include:
Toronto Stock Exchange (Canada) – Canada's largest exchange, heavily weighted towards financials and natural resources.
Shanghai Composite (China) – Tracks all A-shares and B-shares on the Shanghai Stock Exchange, the primary gauge for mainland Chinese equities.
DAX Index (Germany) – The 40 largest and most liquid companies on the Frankfurt Stock Exchange, Germany's benchmark equity index.
Hang Seng (Hong Kong) – Hong Kong's main market indicator, comprising the largest and most liquid stocks on the Hong Kong Stock Exchange.
BSE Sensex (India) – A market-weighted index of 30 established companies on the Bombay Stock Exchange, India's primary equity benchmark.
Nikkei 225 (Japan) – Japan's leading index of 225 top-rated companies on the Tokyo Stock Exchange, considered a barometer for the Japanese economy.
FTSE 100 (UK) – The 100 largest companies by market cap on the London Stock Exchange, the UK's primary equity benchmark.
Commodities
Gold: A safe-haven asset and hedge against inflation and currency devaluation. Rising gold prices typically signal economic uncertainty, geopolitical tensions, or weakening confidence in fiat currencies.
Copper: Known as "Dr. Copper" for its predictive power, copper prices serve as a leading indicator of global economic health due to widespread use in construction, manufacturing and infrastructure.
Oil: Key to global transportation, manufacturing and geopolitics. Oil price movements directly impact inflation, consumer spending, energy stocks, and the fiscal health of oil-exporting nations.
