
How the ASX 200 bottomed last time oil and yields spiked
Oil and bond yields are spiking again. Here's how the ASX 200 bottomed last time, and what sparked the rally.

Source: Shutterstock
KEY POINTS
- Both the 2022 and 2023 market lows came within weeks of a peak in the US 10-year yield, while oil had peaked back in March 2022
- The rally from late October 2023 was driven by Treasury slowing its long-dated debt issuance, softer US jobs and CPI data, and a Fed that began discussing rate cuts
- Stocks have held up against surging yields this time, with consensus forecasting S&P 500 earnings growth of about 32% in 2026, but the ASX 200 doesn't have the same earnings support
Cast your mind back to 2022. Russia launched its full-scale invasion of Ukraine in February, sending Brent crude well above US$100 a barrel and global bond yields vertical. That kicked off a global central bank hiking cycle, with the first Fed hike on 17 March lifting rates from 0–0.25% to 0.25–0.50%.
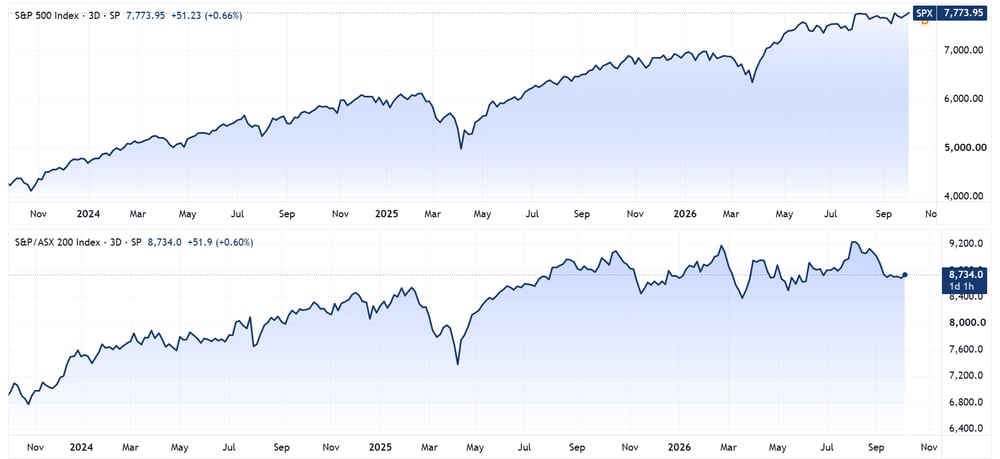
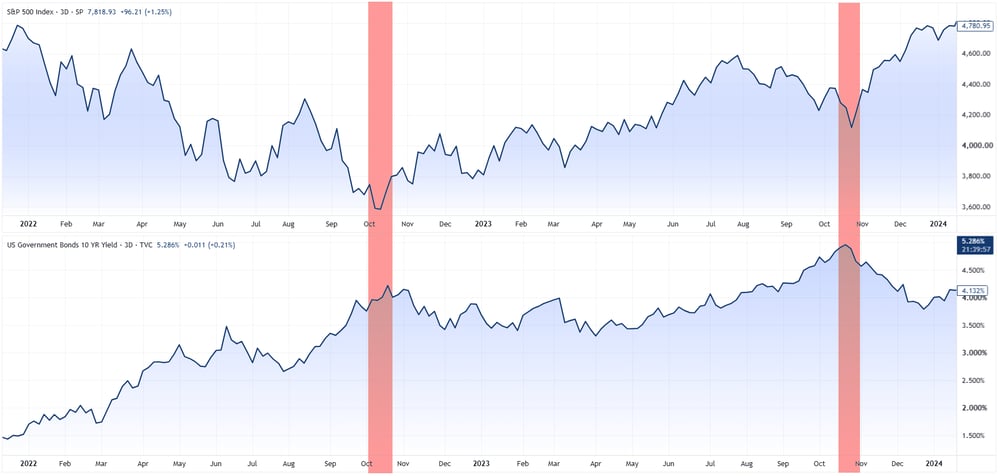
It was a miserable time for markets. The S&P 500 fell almost 20% by October 2022 and the ASX 200 dropped just shy of 10% over the same period. Markets didn't fall much further than that, but price action was choppy at best and conviction was incredibly hard to build. It wasn't until October 2023, when bond yields finally peaked, that markets bottomed and resumed an aggressive next leg up.
If that sounds familiar, it should. Once again, a geopolitical shock has sent energy prices soaring, pushed bond yields vertical and put a fresh round of rate hikes on the table.
It's a same-same but different scenario. In 2022, consumers came into the hiking cycle with pandemic-era savings to cushion the blow. This time, the market is caught between a massive AI-driven earnings boom on one side and a rapidly rising cost of capital on the other.
This piece looks back at how events unfolded in 2022–23 and what ultimately put a floor under the market.
The Russia Ukraine war
Russia's tanks crossed into Ukraine on 24 February 2022, at a time when commodity markets were already tight after the pandemic. Within two weeks:
Oil: Brent crude went from about US$90 a barrel in February to US$139 on 7 March, its highest level since 2008.
Wheat: Rallied nearly 45% to a 14-year high, with Russia and Ukraine together supplying about 30% of global exports.
Thermal coal: Newcastle coal jumped 85% to a record US$440 a tonne.
Aluminium: Hit a record above US$4,000 a tonne.
Nickel: More than doubled to above US$100,000 a tonne on 8 March after a short squeeze on Chinese producer Tsingshan, and the LME suspended trading and cancelled every trade made after midnight that day.
The Bloomberg Commodity Index is the clearest gauge of what the war did to commodity markets. It tracks 23 commodities across six groups: energy, precious metals, base metals, grains, softs and livestock. The index was already trending higher as the global economy reopened after the pandemic, and the invasion sped it up. By early June, it was up as much as 27.5% from where it stood when the conflict began.
Bloomberg Commodity Index chart (Source: TradingView)
CPI rallies and selloffs
Through the back half of 2022, the monthly US CPI release was the biggest day on the calendar. Even a small miss or beat could swing markets massively, and each print had material implications for the size of the Fed's next hike.
10 June 2022: May CPI came in at 8.6% vs 8.3% expected. The S&P 500 fell 2.9% on the day, and another 3.8% the next. A week later, the Fed hiked 75 bps, its largest move since 1994.
13 July 2022: June CPI hit 9.1%, the highest since 1981. This was the peak.
10 August 2022: July CPI came in at 8.5% vs 8.7% expected, with prices flat for the month. The S&P 500 rose 2.1% to a three-month high.
13 September 2022: August CPI rose 8.3%, a smaller slowdown than Wall Street had expected, and core inflation rose double the expected amount for the month. The S&P 500 fell 4.3% and the Nasdaq 5.2%, the S&P's worst day since June 2020.
13 October 2022: September CPI was 8.2%, and core reached 6.6%, a 40-year high. The S&P 500 fell 2.4% in early trade, but rallied off lows to finish 2.6% higher.
10 November 2022: October CPI came in at 7.7% vs 7.9% expected, and core was 6.3% vs 6.5%. The S&P 500 jumped 5.5%, its biggest reaction to a CPI print since records began in 2003, and the 10-year yield fell 27 basis points to 3.82%. The next day the ASX 200 rose 2.8% to a five-month high of 7,158.
Here come base effects
Inflation is reported as the change from the same month a year earlier. Once the 2022 commodity spike became the comparison month, the annual rate fell quickly, even though prices stayed high.
US headline CPI fell for 12 straight months, from 9.1% in June 2022 to 3.0% in June 2023, the lowest since March 2021. Australia ran about six months behind. Local CPI peaked at 7.8% in the December quarter of 2022, the highest since 1990, and was still 5.4% in the September quarter of 2023.
The October 2023 bottom
By July 2023, Brent was trading in the mid US$70s. The S&P 500 was up about 28% from its October 2022 low but only slightly above pre-invasion levels. The ASX 200 was 15% above its 2022 lows and also sat slightly above where it was before the invasion.
But bond yields started to move out again in August 2023. The US 10-year broke above its October 2022 high of 4.33% by September, and the outbreak of the Israel-Hamas war in October pushed it within arm's reach of 5%.
Powell also did the markets dirty at the Economic Club of New York on 19 October. He said inflation was still too high and that a few months of good data was only the beginning. Asked whether policy was too restrictive, he said: "Does it feel like policy is too tight right now? I would have to say no."
The 10-year crossed 5% that day for the first time since July 2007. The S&P 500 fell 0.8% and lost another 3.7% over the next five sessions.
Friday, 27 October marked the low for the S&P 500. The ASX 200 bottomed the following trading day, on 30 October.
The turn came quickly over the next six weeks, driven by a change in Treasury's borrowing plans, softer jobs and inflation data and a shift in the Fed's outlook.
1 November: Treasury said it would slow the increases in its long-dated debt auctions and lean more on shorter-dated notes, and the Fed left rates unchanged. The 10-year yield fell almost 20 basis points, its biggest one-day drop since March.
3 November: October payrolls rose 150,000 vs 180,000 expected and unemployment rose to 3.9%. The S&P 500 finished the week up 5.9%, its biggest weekly gain since November 2022.
14 November: October CPI came in at 3.2% vs 3.3% expected, and core slowed to 4.0%, the lowest since September 2021. The 10-year fell to 4.44% from 4.63%. The Russell 2000 jumped 4.8%, and traders dropped bets on further hikes and priced in four rate cuts starting in May.
13 December: The Fed's dot plot pencilled in three cuts for 2024, and Powell said the timing of cuts had become a topic of discussion. The Dow closed at a record and the 10-year fell below 4%.
S&P 500 (TOP), ASX 200 (bottom) | Source: TradingView
Putting it all together
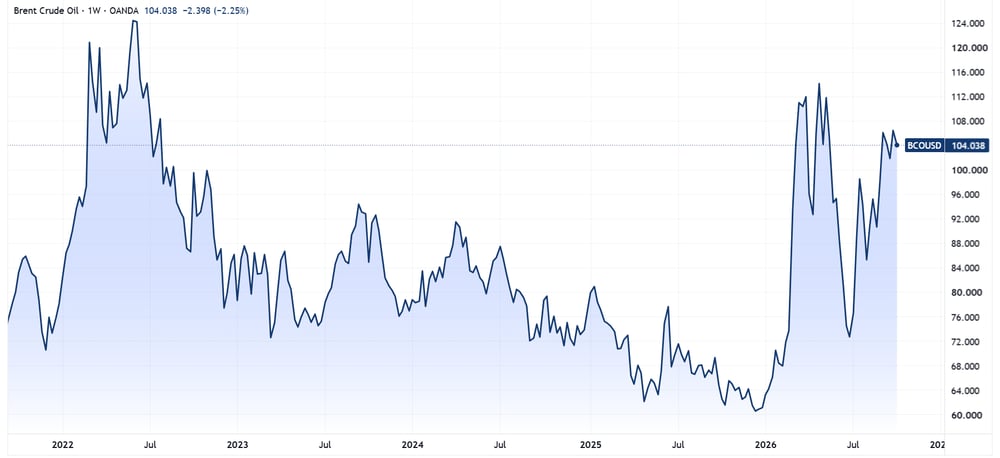
Both market lows came within weeks of a peak in bond yields. The October 2022 low arrived as the 10-year topped out at 4.33%, and the October 2023 low came eight days after Powell's Economic Club speech pushed it to 5%. This is clearly a trend to watch out for today, though bond yields have shown no convincing evidence of peaking and Brent continues to trade around US$100 a barrel.
S&P 500 (TOP) vs. US 10-year yield (bottom) | Source: TradingView
Another factor to consider is how resilient stocks have been in the face of surging bond yields. Perhaps the two are actually on the same side of the argument. A recession-resilient economy should, in theory, push yields higher, and that same economy encourages equity investors to assume still-solid earnings growth.
So without a present danger to the economy, high yields and resilient markets can co-exist. That may explain why the S&P 500 and Nasdaq continue to grind higher, with consensus now penciling in S&P 500 earnings growth of about 32% in calendar 2026 and about 16% in 2027. The same can't be said for the ASX. Earnings grew around 10% in FY26, largely on the back of resources, and are forecast to slow to about 4% in FY27, with the heavyweight banks offering little in the way of growth.
