
How does the ASX 200 perform in September?
September is the ASX 200's worst month on record. This year it arrives with bond yields, commodities and a hawkish Fed piling on.

.jpg)
Source: Shutterstock
KEY POINTS
- Since 1980 the ASX 200 has averaged a 0.42% decline in September and risen just 54% of the time, the worst month for average returns.
- Total returns data since 2001 looks worse again, with September averaging a 0.65% fall and finishing higher only 44% of the time.
- More bearish forces are converging, with Australia's 10-year yield is at its highest since 2011, Brent trading above US$90 and September Fed hike odds have jumped to 65%.
September is here. The most feared month on the investor calendar, with the worst average returns of any month and one of the weakest hit rates for gains.
This is the month that gave us:
1990: The fallout from Iraq's invasion of Kuwait rolled on, oil surged more than 150% and equities kept sliding into an October bottom
2000: The dotcom implosion accelerated, oil spiked and the euro was in freefall
2001: The 9/11 attacks shut the NYSE for four sessions, with the Dow down 7.1% on reopening
2008: Catalysts everywhere. Lehman collapsed on the 15th, the Dow dropped 777 points on the 29th and ASIC banned short selling on the 21st, the most aggressive ban anywhere in the world
Fast forward post-pandemic and it doesn't get much better. 2021 brought China's Evergrande crisis and 2022 brought the 13 September US CPI print that sent the S&P 500 down 4.3% in a single session.
At this point I probably sound like I'm fearmongering, but you get the point. Bad things tend to happen in September, though luckily, October has the tendency to bottom markets.
Since 1980, the ASX 200 has averaged a 0.42% decline in September and finished higher just 54% of the time. That ranks it the worst-performing month and second worst for positive returns.
.xlsx%20-%20Excel.png)
Source: Market Index
Our S&P/ASX 200 Total Returns data only goes back to 2001. On that basis, September has averaged a 0.65% decline and finished higher just 44% of the time, making it the worst month on both measures.
.xlsx%20-%20Excel.png)
Source: Market Index
Recent Septembers have been no kinder on either measure.
.xlsx%20-%20Excel.png)
Source: Market Index
Seasonality meets broader headwinds
Markets aren't just walking into a historically weak September. Bond yields have also pushed out to levels that typically put downward pressure on equities.
US 2-year yield at 4.34%, almost at the highest since Feb-25
US 10-year yield hit 4.75% for the first time since Jan-25
US 30-year yield V-shaped back to 5.24% after a brief pullback, still trading at levels not seen since Aug-07
Australian 10-year at 5.13%, the highest since Jun-11
Australian 30-year yield at 5.65%, an all-time high since issuance began regularly in 2016
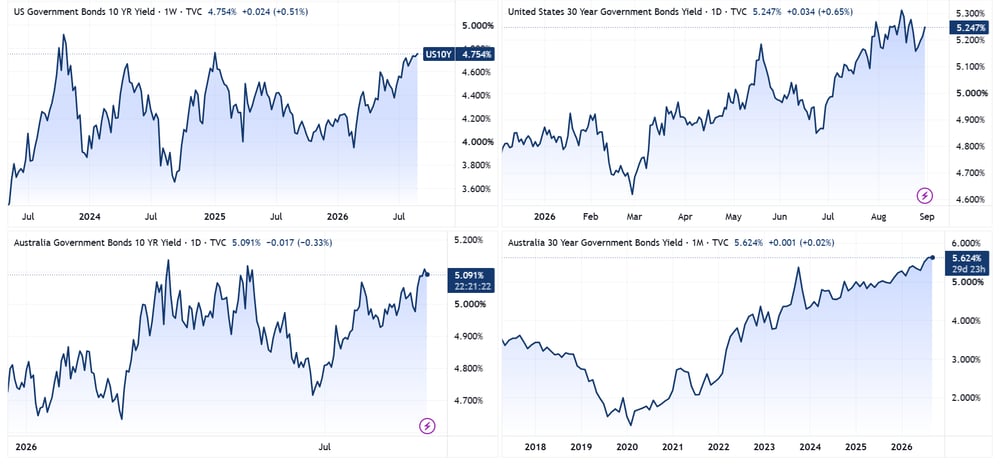
US 10-and-30 year yields (TOP) and Australia 10-and-30-year yields (bottom) | Source: TradingView
At the same time, commodity prices have stayed stubbornly high. Ongoing US-Iran tensions and thin tanker traffic through the Strait of Hormuz have kept oil elevated, with Brent near US$91 a barrel and roughly 26% above the 2 July low. Oil is still well off the US$100 highs, but downstream markets remain as tight as ever, with NY Harbor Diesel futures near record highs. Chinese coking coal futures posted their biggest monthly gain on record in August, up 46%, according to Bloomberg. Meanwhile, the Bloomberg Commodity Index, which tracks futures across energy, agriculture, metals and livestock, is up 15% since July and back near record highs.
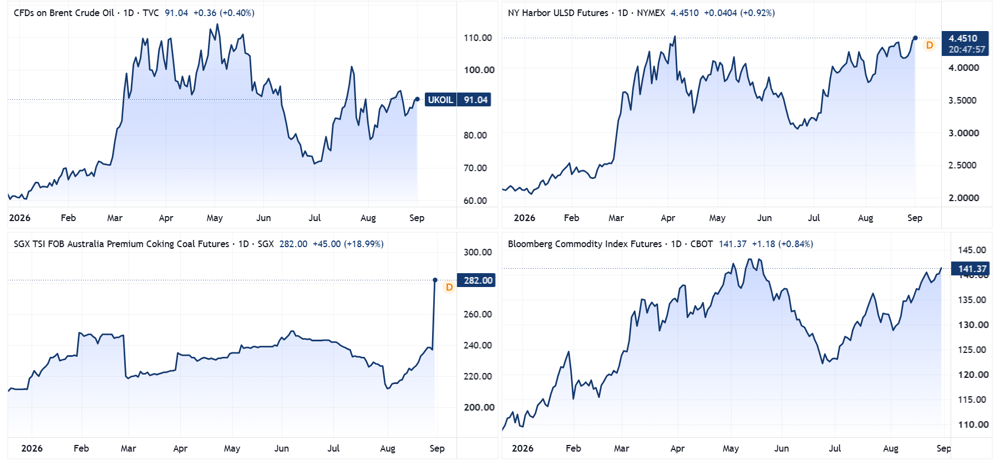
Brent (top left), NY Harbor ULSD futures (top right), Coking coal futures (bottom left) and Bloomberg Commodity Index (bottom right) | Source: TradingView
This inflationary backdrop, along with Fed Chair Kevin Warsh's first Jackson Hole speech, lifted the odds of a September hike from 41% to 65%. Year-end pricing now has one hike fully baked in, with a slight edge towards two.

Source: CME Fedwatch Tool
The bottom line: September is a challenging month for equities at the best of times. Add bond yields at multi-year highs, surging energy and agricultural commodities and a hawkish Fed, and this year's version has a lot more than seasonality working against it.
