Gold's third-longest streak in 50 years just ended. Here's what comes next
Gold just cracked its 200-day for the first time in 660 days. History says the headline is scarier than the outcome.

Source: Shutterstock
Mentioned
KEY POINTS
- Gold entered a bear market, falling 20% from its January high after a blowout US jobs report revived rate hike bets and ended a historic 660-day streak.
- This was only the third-longest run above the 200-day since 1970. Eight of ten past breaches proved mid-trend dips, not cycle tops.
- Forward returns after a breach skew positive. Gold averaged 19.3% one year out, and UBS still tips US$5,500 by year-end.
Gold fell below its 200-day moving average for the first time since October 2023 and entered official bear market territory, having declined more than 20% from its January all-time high of US$5,598 an ounce.
A 3.2% fall last Friday ended a historic 660-day run above the key 200-day moving average.
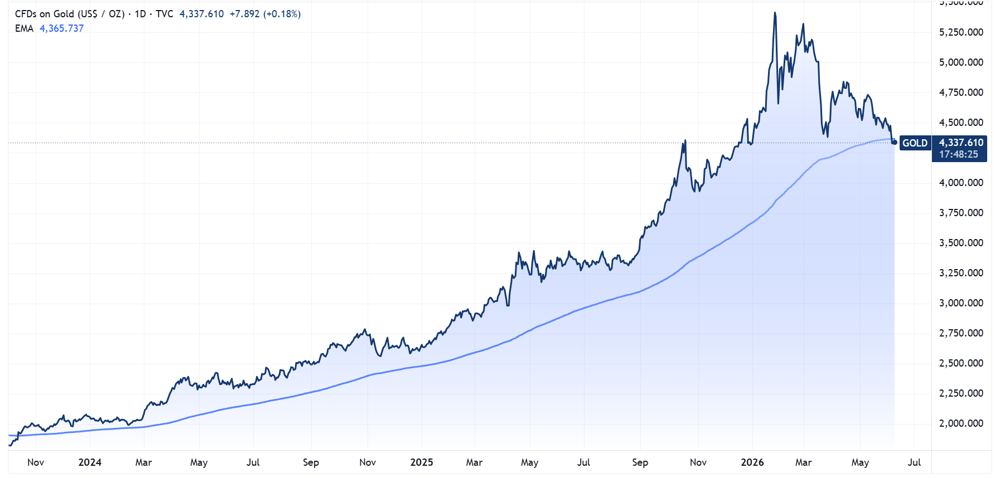
Gold price vs. 200-day moving average chart (Source: TradingView)
The main catalyst was a blowout US jobs report, with payrolls of 172,000 more than doubling market expectations of 86,000. The policy-sensitive US 2-year jumped 10 bps on the print to 4.14%, its highest since February 2025, while Fed Funds futures moved to price 21 bps of hikes through year-end (up from 13 bps pre-report) and now fully price a hike by February, brought forward from March.
The third largest streak
This 660-day run is the 3rd longest streak above the 200-day since 1970 (my data only goes back this far). Here's a quick look at the top 20 longest streaks across the data set.
Rank | Start | End | Length (days) | Start price | End price | Peak gain | Gain to breach |
|---|---|---|---|---|---|---|---|
1 | 16/10/1970 | 29/10/1973 | 755 | $38 | $126 | 235% | 161% |
2 | 20/01/2009 | 13/12/2011 | 733 | $856 | $1,897 | 122% | 91% |
3 | 18/10/2023 | 4/06/2026 | 660 | $1,947 | $5,416 | 178% | 130% |
4 | 28/10/1976 | 24/11/1978 | 520 | $126 | $247 | 96% | 60% |
5 | 1/12/1978 | 6/11/1980 | 488 | $200 | $826 | 313% | 207% |
6 | 1/08/2001 | 20/03/2003 | 420 | $268 | $382 | 43% | 24% |
7 | 17/06/1986 | 28/01/1988 | 408 | $337 | $497 | 48% | 39% |
8 | 20/12/2018 | 17/03/2020 | 311 | $1,260 | $1,680 | 33% | 21% |
9 | 1/08/2005 | 8/09/2006 | 290 | $432 | $715 | 66% | 41% |
10 | 21/04/2003 | 20/04/2004 | 261 | $333 | $426 | 28% | 18% |
11 | 17/08/2007 | 4/08/2008 | 252 | $657 | $1,002 | 53% | 36% |
12 | 20/03/2020 | 25/11/2020 | 175 | $1,499 | $2,064 | 38% | 21% |
13 | 10/09/2004 | 11/05/2005 | 174 | $402 | $455 | 13% | 6% |
14 | 3/02/2016 | 5/10/2016 | 171 | $1,142 | $1,366 | 20% | 11% |
15 | 20/12/2022 | 15/08/2023 | 163 | $1,818 | $2,050 | 13% | 5% |
16 | 4/12/1973 | 3/07/1974 | 145 | $106 | $180 | 70% | 29% |
17 | 18/08/1982 | 25/02/1983 | 132 | $360 | $510 | 42% | 23% |
18 | 1/10/1974 | 11/04/1975 | 130 | $156 | $196 | 25% | 11% |
19 | 16/12/1985 | 13/06/1986 | 125 | $322 | $362 | 12% | 8% |
20 | 12/01/2007 | 25/06/2007 | 116 | $627 | $691 | 10% | 4% |
All gain figures use daily closing prices. Peak gain measures the streak start to its highest close; Gain to breach measures the streak start to its final close before the 200-day moving average was lost (Source: Market Index)
A few interesting observations:
The current run-up of 178% is the third largest ever recorded inside a single streak. It trails only the 1978-80 bubble, which peaked near 313% before falling 30% over the following year, and the 1970-73 run of roughly 235%, which instead kept climbing another 74%.
Of the 10 long-streak breaches, only two marked true cycle tops (1980 and 1988) and both delivered weak returns at every forward horizon. The other eight turned out to be mid-trend corrections that eventually resolved higher.
The two longest analogs point in opposite directions. The 1970-73 run gained 74% over the following year, while the 2009-11 run managed just 8% at twelve months before rolling over (down 21% after two years).
Gold has spent 61% of all trading days since 1970 above its 200-day moving average, so sitting above the line is really its resting state rather than a signal in itself.
How does gold perform after a breach?
A close below the 200-day is widely viewed as a sign that long-term bullish momentum has weakened. As the old saying goes: "nothing good happens below the 200-day." But taking a look at how gold has historically performed after a break below the 200, things look relatively positive
The forward returns below are based on the 19 instances above.
1 Week | 1 Month | 3 Months | 6 Months | 1 Year | 2 Years | |
|---|---|---|---|---|---|---|
Average | 1.2% | 3.0% | 7.2% | 12.9% | 19.3% | 29.1% |
Median | 1.7% | 3.8% | 5.4% | 7.2% | 12.9% | 33.5% |
% Positive | 68% | 74% | 74% | 79% | 79% | 58% |
Source: Market Index
Where to from here?
Analysts remain largely bullish on gold. The latest from UBS (1-Jun) expects gold to rebound to US$5,500/oz by year-end, as elevated debt, US fiscal deficits and continued central bank reserve diversification outweigh the current pressures from higher energy prices, US dollar strength and tighter Fed policy.
Elsewhere, the World Gold Council argued that gold could benefit from a Fed hike.
Gold has posted positive returns more than 50% of the time following Fed hikes, with median 21-day post-hike returns above the long-run average of 0.84%.
US dollar moves matter more than rates themselves for gold's response, with consensus pointing to a weaker dollar ahead on growth and yield convergence and diversification away from US assets.
Historical precedents where gold rallied through hikes share today's features: Fed hiking into fragility (June 2006), dovish-relative-to-expectations hikes (March 2017), perceived policy errors (December 2018), and tightening into market stress (November 2022, March 2023).
Structural support seen from China, India and central bank demand, which are less sensitive to US rates.
The bottom line: The 200-day breach makes for an ominous headline, but history says it's more often a pause than a peak. That said, gold has shown elevated volatility in recent months and genuinely struggled to find any constructive consolidation. The 200-day is no doubt a key level that needs to hold.
