Does the ASX 200 rally after US midterms? History says yes, just not straight away
A Democratic sweep has Wall Street betting on peace in Iran. History suggests the post-midterm rally could have legs on the ASX too.

Source: Market Index
KEY POINTS
- Since 1950, the S&P 500 has averaged a 14.1% gain six months after a midterm and 15.2% after a year, finishing higher in all 19 cases.
- After midterms, the ASX 200 behaves like a weaker S&P 500. One-month returns are mostly negative, but the index is firmly higher three, six and 12 months out.
- Brent fell 9.3% overnight as a Democratic Congress raised hopes of ending the US-Iran war, boosting the rotation into Discretionary, Real Estate and Staples and reviving beaten-up miners.
The US midterm elections are done and dusted, resulting in a sweeping "blue wave" that well exceeded pre-election polling expectations. US futures initially traded sharply lower but finished the overnight session broadly higher, on hopes that a Democratic Congress will force an end to the US-Iran war and ease the energy supply crunch.
The S&P 500 surged 1.6% and now trades within 2% of its 6 October all-time high, while the Dow rallied 1,569 points or 3.0%, its best day since April 2025. One of the more notable moves was Brent, which fell 9.3% to US$94.49 a barrel. Base and precious metals traded broadly higher, with gold up 3.3% and silver up 4.9%.
US stocks tend to rally after midterms
There’s been plenty of coverage about how strongly the US market tends to perform after midterm elections, even when a Republican President faces a Democratic Congress.
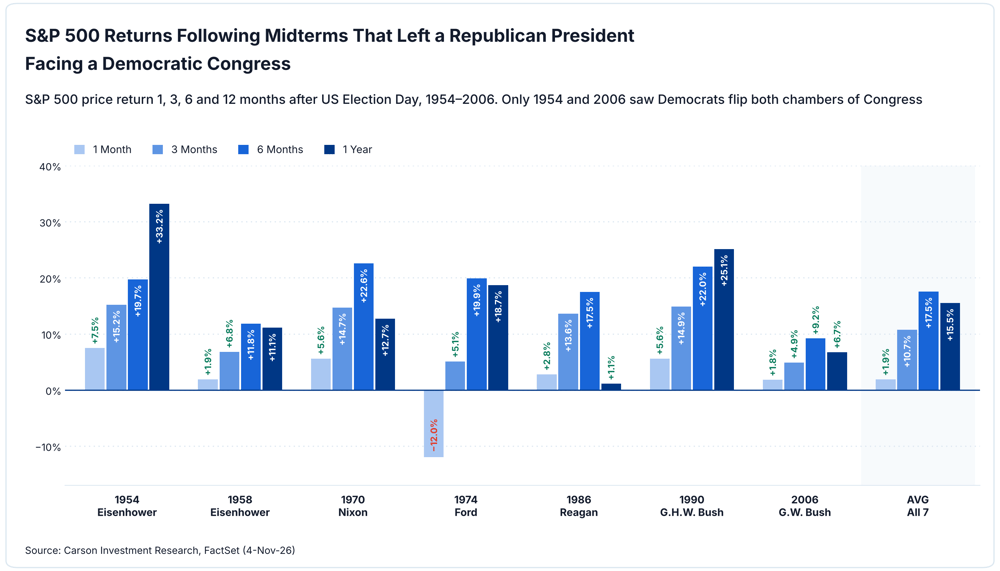
Across all 19 midterm elections since 1950, the S&P 500 averages:
One month later, up 1.6% and positive 79% of the time
Three months later, up 7.7% and positive 89.5% of the time
Six months later, up 14.1% and up 100% of the time
One year later, up 15.2% and up 100% of the time
How does the ASX 200 perform?
So what about the ASX 200?
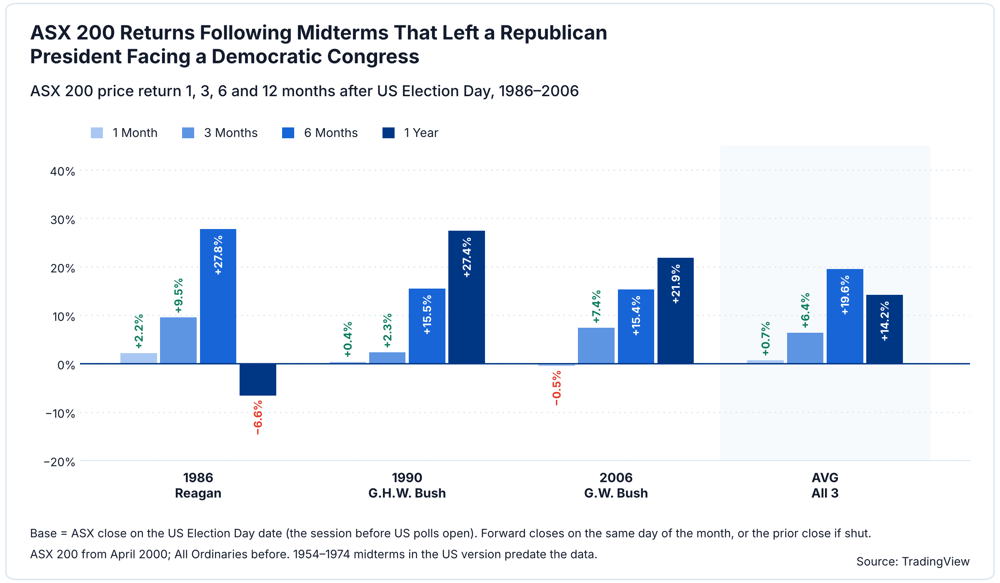
The data for a Republican President and a Democratic Congress is a little thin. The ASX 200 index officially started in March 2000, the data before that uses the All Ords, and our data only goes back to the 1980s. That leaves just three comparable midterms: 1986, 1990 and 2006.
The sample size is tiny, but the forward returns are all relatively positive. The only thing that might raise an eyebrow is how gains evaporated 12 months after Reagan’s 1986 midterm. The ASX suffered a one-day selloff of 25% on 20 October 1987, famously known as “Black Tuesday”.
Look at every US midterm election and the ASX 200’s forward returns are pretty much a weaker version of the S&P 500’s. One-month returns are overwhelmingly negative, but the index is firmly higher three, six and 12 months out.
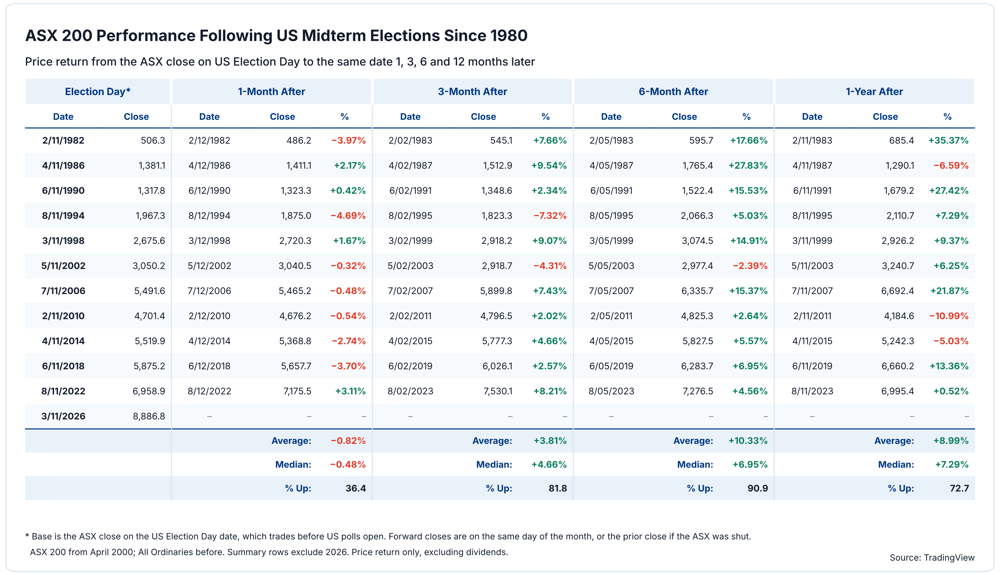
Overall, midterm election uncertainty is winding down, which is historically bullish for equity markets.
Market breadth improves on peace hopes
Today's broad-based rally (outside of energy) only strengthens the market's recent pivot towards consumer-facing and yield-sensitive sectors like Discretionary, Real Estate and Staples. These sectors have benefited from peaking bond yields and hopes that the global rate hike cycle is nearing its end. Meanwhile, the sharp fall in oil prices has pumped life back into miners, which have been smashed by a mix in high energy prices, a soaring US dollar and sensitivities to the AI trade.
The Democratic sweep has only solidified this rotation, as it leaves Trump with less political capital to keep the US-Iran war going (in fact, the country has shifted so far blue that Democrats now have a mandate to end the conflict). As oil prices come back down to earth, so does inflation, even if downstream products like jet fuel and diesel remain tight.
The “blue wave” has arguably further stoked an already broadening market rally, and with it, buoyed some of the recently battered sectors like miners and software.