ChartWatch Markets: Scintillating silver eyes all-time high, gold also rallies, as bitcoin's bull run comes under serious threat
Technical analysis of the most important global stock indices, commodities, bonds, FX, and crypto impacting your ASX portfolio each day.


Source: Shutterstock
Mentioned
KEY POINTS
- The silver price is again soaring, making multi decade highs at the time of writing. It’s hot, and the next major resistance level isn’t until the all-time high of 58.36 from way back in 2011 – but is it “too hot”!?
- Gold is making its own steady assault on its recent 4398 high. Perhaps it will be back to “lines around the block” of investors clamouring to buy. But today’s analysis suggests there remains one major hurdle to overcome.
- Bitcoin has often been referred to as “Digital Gold”. But its recent price performance has been anything but alike. Our resident technical analysis expert made an excellent call on it last week, down, and he believes there could be further pain to come.
In today's edition of ChartWatch Markets, we'll be covering the technicals for:
Nasdaq Composite
Gold Futures (Front month, back-adjusted) COMEX
Silver Futures (Front month, back-adjusted) COMEX
Bitcoin vs US Dollar
Nasdaq Composite Index
Analysis
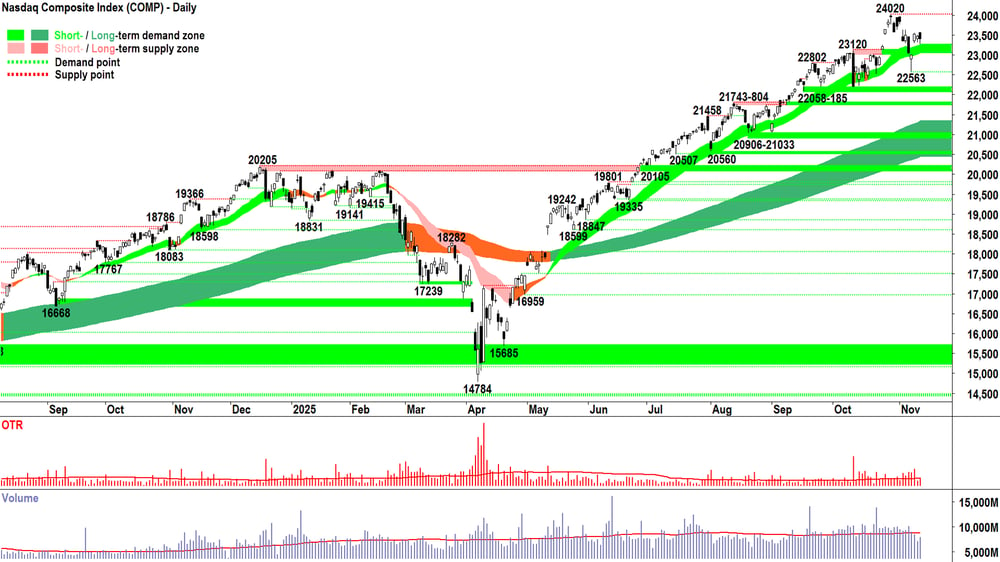
In our last Comp analysis on Tuesday, we noted a substantial improvement in the candles (starting with Friday’s long downward pointing shadow), but that below average volume indicated we had likely not yet encountered the latent supply expected to be lurking around 24020.
In yesterday's webinar, we noted no change as per Tuesday's candle. Today we look at Wednesday’s candle – a modest supply-side showing on below average volume. A modest downward pointing shadow suggests the demand-side is still lurking.
A bit of supply hit a bit of demand and supply was slightly more motivated. There’s little information in it for me, so I’ll defer to the candles/price action heading in:
(Consistent with demand-side control = ✅ vs Consistent with supply-side control = ⚠️)
ST / LT Trends ⬆️/⬆️; both trend ribbons appear to be acting as zones of dynamic excess demand ✅
Price action: Still falling peaks and falling troughs; balance point of the 24020-22563 move is 23292 (i.e., mid-point – it implies the “balance point” between demand and supply for that move) versus best close in 22563 to present rally = 23527. ⚖️
Candles: Balanced since 24020, but clearly the strong performance since the 7-Nov 22563 point of demand is excellent (strong up 7-8-Nov versus holding above the low of 8-Nov candle and above the short term trend ribbon = 👍) ✅
Two ✅ and one ⚖️. Still sounds pretty good for demand-side control to me!
I 100% continue to expect we’re going to have a supply-side interaction somewhere between here and 24020 (read as above average volume days). This isn’t a bad thing, because we get to see how the demand-side responds:
Do they soak up that supply and log strong demand-side candles (i.e., long white-bodied and or long downward pointing shadows)? 🤔
Or
Do they capitulate under the supply-side's quantity and motivation (i.e., long black-bodied and or long upward pointing shadows)? 🤔
It really is that simple. The market will tell us who’s in control through the price action and candles. We simply must be patient and let it do it job – but with open eyes and minds to the possibilities! 👀
View
MOTN (More Often Than Not) ✅✅⚖️ = P⬆️. Therefore I remain FRP on the Comp (Full Risk Position corresponds to a 100% allowable capital allocation limit for US stocks based on my personal risk management model).
Key levels
22563 it is a "critical line in the sand" for demand-side control – and therefore a close below this point will trigger a cut to my US capital allocation limit to 2/3RP. The next critical zone of demand below 22563 is 22058-185 – below it, the short term trend is likely down, and the long term trend is under significant pressure = ⚠️ 24020 is the critical point of supply, we don't want to see major supply-side signals there = ⚠️
Gold Futures (Front month, back-adjusted) COMEX
%20COMEX%20chart_13%20Nov.png)
Analysis
The last time we covered gold was in ChartWatch Markets on 11-Nov.
In that update, we noted a substantially improving set of techincals, leading me to conclude “I can see, there’s likely more in this latest gold rally”. But, as with the Comp analysis above, gold (and silver) must still address the issue of substantial latent supply likely lurking around their recent major points of supply.
For gold, it’s 4398.
Really there’s not a great deal to add here compared to the concepts discussed above in the Comp analysis. Yes, there’s a very strong demand-side showing in Wednesday's candle ✅ Yes, trends, price action and candles are all realigned with demand-side control ✅✅✅.
We just need to see how the price action and candles, as well as accompanying volume play out in the approach to 4398 🧐.
It’s rare to see little-to-no response at such a level – particularly when it was formed by such a strong supply-side showing as the 21-Oct long black candle on massive volume.
There’s a pile of supply likely trapped in at the higher prices of that candle – and some of them may wish to undo their “mistake” by exiting (i.e., supplying) at breakeven.
View
As per last update, I am happy to remain at my present risk exposure on gold, i.e., "=R". Wednesday's candle has me leaning back towards a +R, though! 😉 I just want to see how the next few candles play out.
Key levels
3109-35 is the closest zone of demand, the price should not close below here if the demand-side is in control of gold's price, thereby nullifying the short term uptrend = ⚠️
Silver Futures (Front month, back-adjusted) COMEX
%20COMEX%20chart_13%20Nov.png)
Analysis
The last time we covered silver was in ChartWatch Markets on 11-Nov.
In that update, I noted (rather prophetically I might add 😉) that “silver is tracking along relatively better than gold with respect to its major point of supply test (i.e., at 53.77)”
In fact, if we look at the current candle (last-most on the chart), it’s tickling it right now!
But live candles are irrelevant – only closed candles matter – so we must discount it! 🙅
Wednesday’s long white-bodied candle with close near the high of the session is a monster demand-side showing. The complete lack of a pullback since the 46.52 point of demand suggests unequivocal demand-side control.
And this is where silver diverges from the Comp and gold – it has logged an emphatic candle close very near its major point of supply.
This is exactly the signal that we’re still awaiting on the Comp and Gold – confirmation that the supply-side has very little desire or quantity lurking near the old high.
At least, they certainly haven’t shown it yet. But, I must conclude that they’ve had enough of a chance by now to interact with the demand-side… so I’m happy to make the call that 53.77 is nullified as a point of supply.
Wednesday’s above average volume, when paired with the strong demand-side price action, is consistent with supply removal. Exactly what we want to see.
View
Based on silver's trends, price action, and candles, my model considers MOTN = P⬆️. Therefore, my model allows for either =R or +R.
Key levels
The short term uptrend ribbon (presently 48.35-49.40) is the closest zone of demand, the price should not close below here if the demand-side is in control of silver's price; below this, the 45.51-4586 demand zone will likely serves as a critical go-no go zone for the silver bull market. If silver can close above 53.77, the next major point of supply is the all time high of 58.36 set on 24-Apr 2011.
Bitcoin vs US Dollar
Analysis
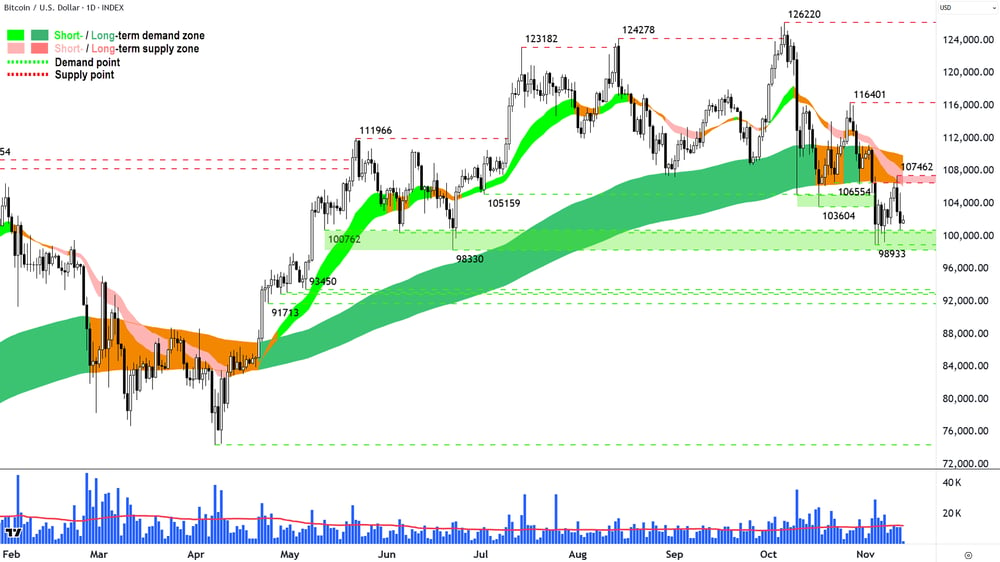
The last time we covered bitcoin was in ChartWatch Markets on 4-Nov.
In that update, the first on bitcoin in several months, I noted that my trend following model had identified the most compelling potential opportunity during that entire time: -R due to the Turnaround Setup that had developed at the long term trend ribbon.
In a "Short" Turnaround Setup, the price of a stock is transitioning from a neutral long term trend to a long term downtrend, from an earlier state of long term uptrend.
Long term trend ribbon is neutral (amber) or down (dark pink), i.e., it cannot be up (dark green)
Short term trend ribbon is down (light pink)
Price action is falling peaks and falling troughs
The price has closed below the long term trend ribbon, and has set a peak in or below it
Predominance of supply-side candles (i.e., those with black bodies and or upward pointing shadows)
A strong supply-side candle (i.e., a relatively long supply-side candle)
Bitcoin ticked all the boxes.
The condition of a peak in or below the long term uptrend ribbon was at the time “in”. A trough set below the long term trend ribbon is obviously a stronger signal than one set within it – but I’m happy to go a little earlier if the other signals are suitably indicative of supply-side control. Hence my call on 4-Nov.
What’s neat about how the bitcoin price action has developed, is that low and behold, the confirmatory peak below the long term trend ribbon has occurred! Even better, it’s occurred on some convincing supply-side showings in the form of the 11-12-Nov candles (black-bodied and or upward pointing shadows).
Really now, only 98933, and perhaps 98330, stand in the way of a potentially deeper retracement for bitcoin.
View
No change from my 4-Nov view = my model requires ZRP or -R.
Key levels
98330-98933 is the closest zone of demand, the price should not close below here if the demand-side is in control of bitcoin's price; it's likely that the short term trend ribbon (presently 106100-107950) and the long term trend ribbon (presently 106460-109900) will act as zones of dynamic supply.
Did you miss this week's ChartWatch *LIVE* Webinar? No problems, catch the recording!
And if you want access to Carl's fantastic Trend Ribbons on your TradingView platform, be sure to follow the instructions in the video description.
ChartWatch *LIVE* Webinar
ChartWatch *LIVE* Webinars – WEEKLY Wednesday's @ 12pm AEDT
Learn more about technical analysis and trend following through real case studies on ASX stocks. Australia's premier technical analyst, Carl Capolingua, shares his unique insights on stocks as requested by viewers. Ask about a company in your portfolio or anything related to trading and investing and get Carl's expert opinion.
Places are limited so >REGISTER NOW!<
