
ASX 200 winners and losers at lunchtime: Who’s thriving and diving amidst Trump’s tariff chaos
President Trump has thrown another curveball at the stock market, but while the ASX 200 is down, some stocks are prospering amid the chaos.


Source: Shutterstock, Market Index
Mentioned
KEY POINTS
- ASX dips after Trump’s latest tariff threat: Renewed trade war jitters hit global markets overnight, with Wall Street tumbling and local shares modestly lower by midday.
- Not every stock is sinking: Some ASX names are quietly outperforming the benchmark, showing early signs of institutional buying amid the mild pullback.
- There’s a tool for that: Discover how Relative Strength Comparative (RSC) helps investors objectively identify which stocks are beating – and which are lagging – the market.
After a bruising session on Wall Street where major stock indices fell 2-3%, the S&P/ASX 200 has largely shrugged off this latest round of Trump tariff sabre rattling (TACO’s anyone!?). At the time of writing, the Australian stock benchmark is down around 54 points or just 0.6%. Meh! 🫤
But this doesn’t mean that all local stocks have dodged the Trump tariff bullet. As with any trading session on the ASX, there are winners and losers. The critical factor for investors is to try to understand the drivers behind why one sector is being favoured by the big fund managers over another. The goal is to incorporate this into an investing strategy that aims to hold the strongest stocks, or at the very least, avoid the worst stocks.
It's all relative…
In essence, what we’re really discussing here is the concept of relative strength. This measures how one stock or sector is performing compared to another – typically against a broader benchmark like the ASX 200. It’s not about whether a share price is rising or falling in absolute terms, but how it’s moving relative to the rest of the market. A company that’s flat on a down day is actually showing quiet strength; one that’s lagging while the index rallies is flashing early weakness.
This is where professional investors find their edge – they don’t just track what’s going up or down, they track what’s outperforming. Because in markets, leadership matters. The stocks that consistently rise faster, or fall slower, than their peers tend to attract institutional attention first, often signalling where the next wave of market strength is building.
ASX stocks demonstrating the greatest relative strength at midday:
Company | Last Price | Change $ | Relative to ASX 200 % |
|---|---|---|---|
Regis Resources (RRL) | $5.88 | +8.0% | +8.6% |
Lynas Rare Earths (LYC) | $20.60 | +7.6% | +8.2% |
Catalyst Metals (CYL) | $7.33 | +6.6% | +7.2% |
Iluka Resources (ILU) | $7.78 | +5.7% | +6.2% |
Genesis Minerals (GMD) | $5.98 | +5.6% | +6.2% |
Bellevue Gold (BGL) | $1.200 | +5.1% | +5.7% |
Vault Minerals (VAU) | $0.690 | +4.0% | +4.6% |
Westgold Resources (WGX) | $5.42 | +3.9% | +4.4% |
Emerald Resources (EMR) | $5.00 | +3.7% | +4.3% |
Evolution Mining (EVN) | $11.21 | +3.5% | +4.1% |
Newmont Corp. (NEM) | $132.00 | +3.4% | +4.0% |
Capricorn Metals (CMM) | $13.39 | +3.3% | +3.8% |
Greatland Resources (GGP) | $8.16 | +3.2% | +3.8% |
Northern Star Resources (NST) | $24.70 | +2.8% | +3.4% |
Perseus Mining (PRU) | $4.74 | +2.7% | +3.3% |
Ramelius Resources (RMS) | $3.85 | +2.5% | +3.1% |
Transurban Group (TCL) | $14.10 | +2.0% | +2.6% |
Liontown Resources (LTR) | $0.960 | +2.0% | +2.6% |
Qube Holdings (QUB) | $4.17 | +1.9% | +2.5% |
HMC Capital (HMC) | $3.06 | +1.8% | +2.4% |
The best of the rest on a down day
ASX stocks demonstrating the least relative strength at midday:
Company | Last Price | Change $ | Relative to ASX 200 % |
|---|---|---|---|
Treasury Wine Estates (TWE) | $5.99 | -12.2% | -11.6% |
Pinnacle Investment Management Group (PNI) | $17.82 | -5.4% | -4.9% |
Fletcher Building (FBU) | $2.76 | -4.7% | -4.1% |
Block (XYZ) | $115.94 | -4.6% | -4.0% |
Pro Medicus (PME) | $287.50 | -4.3% | -3.7% |
Neuren Pharmaceuticals (NEU) | $20.36 | -4.1% | -3.5% |
Hub24 (HUB) | $99.57 | -3.9% | -3.3% |
South32 (S32) | $3.01 | -3.8% | -3.2% |
Magellan Financial Group (MFG) | $9.89 | -3.7% | -3.1% |
Tuas (TUA) | $6.62 | -3.6% | -3.1% |
Digico Infrastructure Reit (DGT) | $2.86 | -3.5% | -2.9% |
Netwealth Group (NWL) | $31.26 | -3.4% | -2.8% |
Droneshield (DRO) | $5.86 | -3.4% | -2.8% |
Reliance Worldwide Corp. (RWC) | $3.88 | -3.4% | -2.8% |
Computershare (CPU) | $35.87 | -3.3% | -2.8% |
Austal (ASB) | $7.13 | -3.2% | -2.7% |
Generation Development Group (GDG) | $7.12 | -3.0% | -2.4% |
Sims (SGM) | $13.20 | -3.0% | -2.4% |
Guzman Y Gomez (GYG) | $24.91 | -2.9% | -2.3% |
Breville Group (BRG) | $27.95 | -2.9% | -2.3% |
The worst of the rest on a down day
The above tables show that there is a clear preference among fund managers today for stocks in the gold and critical minerals sectors. Defensive income / infrastructure stocks like Transurban Group (TCL) and Qube Holdings (QUB) appear to be outperforming.
Conversely, it’s also clear that stocks among the information technology, biotechnology, and consumer discretionary sectors are so far being more harshly dealt with. Recently high-flying defence stocks like Droneshield (DRO) and Austal (ASB) also appear to be receiving some harsh treatment.
How you can measure relative strength objectively
To move from gut feel to hard evidence, investors can measure relative strength using a simple but powerful ratio called Relative Strength Comparative (RSC). It’s calculated by dividing a stock’s price by the level of a benchmark index – for instance, a company’s share price divided by the ASX 200. The resulting line shows how that stock is performing relative to the broader market:
When the RSC line is rising, the stock is outperforming the benchmark
When the RSC line is falling, the stock is underperforming the benchmark

Commonwealth Bank of Australia (CBA) vs ASX 200 RSC indicator (click here for full size image)
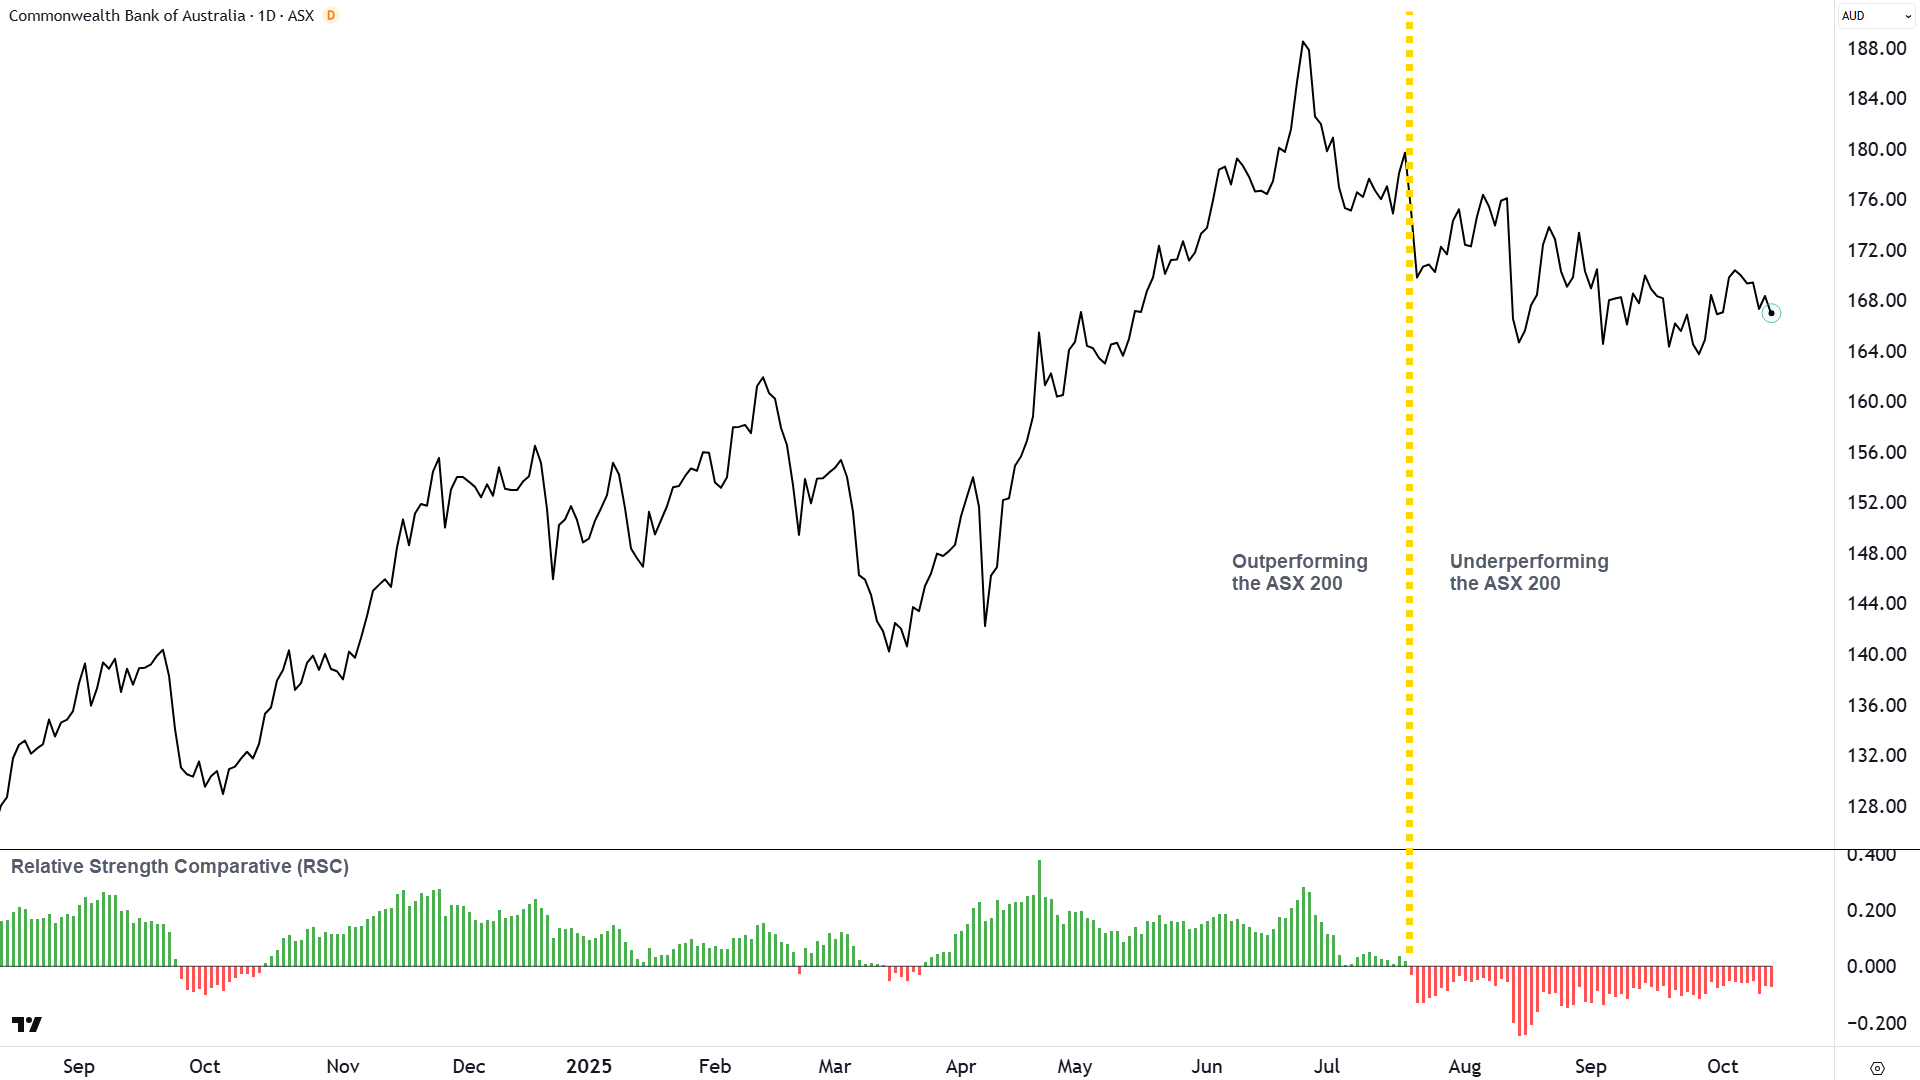
Charting this ratio over time provides an objective lens for identifying market leaders and laggards, removing the noise of day-to-day volatility. The trend of the RSC line, rather than its absolute value, is what matters most – it reveals whether the big fund managers are moving into and out of stocks or sectors – often selling one to buy the other.
(Most good charting platforms include a version of RSC, but don’t confuse RSC with RSI — the Relative Strength Index. RSI is one of the most widely used technical indicators, but it measures a stock’s internal momentum only, without any reference to how it’s performing against the broader market.)
Let’s investigate whether some of today’s themes were evident heading into today’s sell off. Either way, more broadly, which stocks have the best / worst relative strength comparative over the last few months, and up to 1 year. Note I’ll be using my own custom version of RSC here, you won’t find it on any of the major technical analysis platforms – but it performs a similar task to the standard version (just better!).
ASX stocks demonstrating the best relative strength last 3-months:
Company | Last Price | RSC Indicator 3-months |
|---|---|---|
10 BEST ASX 200 STOCKS BY RSC | ||
Droneshield (DRO) | $5.86 | 1.86 |
Lynas Rare Earths (LYC) | $20.60 | 1.31 |
Westgold Resources (WGX) | $5.42 | 1.17 |
Eagers Automotive (APE) | $33.55 | 1.06 |
Iluka Resources (ILU) | $7.78 | 0.92 |
Iperionx (IPX) | $7.63 | 0.77 |
Vault Minerals (VAU) | $0.690 | 0.75 |
Capstone Copper Corp. (CSC) | $13.80 | 0.73 |
Pilbara Minerals (PLS) | $2.52 | 0.69 |
Mesoblast (MSB) | $2.74 | 0.67 |
10 WORST ASX 200 STOCKS BY RSC | ||
Treasury Wine Estates (TWE) | $5.99 | -0.67 |
Wisetech Global (WTC) | $82.66 | -0.56 |
IPH (IPH) | $3.60 | -0.52 |
Bapcor (BAP) | $3.11 | -0.52 |
Ebos Group (EBO) | $25.65 | -0.46 |
Inghams Group (ING) | $2.48 | -0.45 |
Karoon Energy (KAR) | $1.460 | -0.45 |
HMC Capital (HMC) | $3.06 | -0.44 |
GQG Partners Excluding QIB (GQG) | $1.540 | -0.42 |
Viva Energy Group (VEA) | $1.740 | -0.39 |
Top 10 best and worst stocks by RSC last 3 months
ASX stocks demonstrating the best relative strength last 12-months:
Company | Last Price | RSC Indicator 1-year |
|---|---|---|
10 BEST ASX 200 STOCKS BY RSC | ||
Droneshield (DRO) | $5.86 | 1.12 |
Lynas Rare Earths (LYC) | $20.60 | 0.62 |
Iperionx (IPX) | $7.63 | 0.55 |
Eagers Automotive (APE) | $33.55 | 0.52 |
Zip Co. (ZIP) | $4.55 | 0.51 |
Westgold Resources (WGX) | $5.42 | 0.47 |
Catalyst Metals (CYL) | $7.33 | 0.47 |
Life360 (360) | $51.73 | 0.46 |
Mesoblast (MSB) | $2.74 | 0.43 |
Perenti (PRN) | $2.75 | 0.42 |
10 WORST ASX 200 STOCKS BY RSC | ||
HMC Capital (HMC) | $3.06 | -0.38 |
Domino's Pizza Enterprises (DMP) | $14.37 | -0.35 |
Treasury Wine Estates (TWE) | $5.99 | -0.32 |
Bapcor (BAP) | $3.11 | -0.28 |
Reece (REH) | $11.14 | -0.28 |
IPH (IPH) | $3.60 | -0.26 |
Telix Pharmaceuticals (TLX) | $14.59 | -0.23 |
Ebos Group (EBO) | $25.65 | -0.23 |
Inghams Group (ING) | $2.48 | -0.22 |
GQG Partners Excluding QIB (GQG) | $1.540 | -0.21 |
Top 10 best and worst stocks by RSC last 12 months
The above tables show that today’s relative strength winners and losers are not all that different from those of the recent past. Again, there appears to be a clear preference among fund managers towards stocks in the gold and critical minerals sectors, with Droneshield, Eagers Automotive (APE) (consumer discretionary), Mesoblast (MSB) (biotechnology), Zip Co. (ZIP) (financials) and Life360 (360) (information technology) also standouts.
Unfortunately, laggards continue to be laggards with consumer stocks, healthcare and fund managers coming in for some consistently harsh attention. So, the general make up of today’s winners and losers shouldn’t be such a big surprise – if you had been paying attention to RSC! 😉
Trends change, be prepared
In this article we’ve seen which stocks appear to be in or out of favour with the big fund managers today, and over the recent past – but trends are never permanent. Market leadership is fluid. Sectors rise, fall, and rotate as the macro environment, earnings outlook, and investor appetites shift. A stock that looks unstoppable today can quickly lose its shine tomorrow. That’s why monitoring relative strength isn’t a one-off exercise – it’s an ongoing discipline that helps investors stay aligned with where institutional money is flowing.
The beauty of the RSC is that it gives you an objective way to track those leadership changes as they happen. By watching which stocks are quietly improving their RSC – even in flat or down markets – investors can spot emerging strength before it shows up in the headlines. Combined with sound fundamentals, other trend and price action based technical indicators, and good risk management, RSC helps you tilt your portfolio toward the market’s strongest trends and away from its weakest. It’s a practical way to stay prepared for the only constant in markets: Change.
