ASX 200 miners tumble 11% in five days as Fed, US dollar and Iran tensions hammer commodities
The ASX 200 Materials Index wiped out as much as 11% in five days. But the structural demand story hasn't budged.

Source: iStock
KEY POINTS
- A hawkish Fed repricing, firmer US dollar, US-Iran tensions and softening Chinese demand have hit commodity prices, dragging the average large cap miner down roughly 10% this week.
- Gold has erased its stellar start to the year. After surging almost 30% in January, it now sits down around 5% year-to-date following a 9.2% six-day slide.
- Structural tailwinds remain intact. AI-driven capex, rising defence spending and a lack of new supply all support demand, though volatility is extreme for now.
Talk about a U-turn. The S&P/ASX 200 Materials Index went from all-time highs on 3 June, to a five-day skid that wiped out as much as 11%, with more pronounced declines for gold, uranium and lithium miners.
Commodity prices (ex-energy) continued to sell off overnight, with most recording sharp declines over the last six sessions. A high-flying commodity like gold, which was up almost 30% in the first four weeks of the year, is now down around 5% year-to-date.
Commodity | Chg % | 6 Days % | Close (US$) |
|---|---|---|---|
Gold | -4.45% | -9.20% | $4,071 |
Platinum | -3.66% | -14.10% | $1,663 |
Silver | -2.97% | -15.70% | $63.37 |
Copper | -2.23% | -7.00% | $6.24 |
Zinc | -2.15% | -4.60% | $3,439 |
Nickel | -1.48% | -7.70% | $17,651 |
Palladium | -1.10% | -11.20% | $1,214 |
Aluminium | -1.02% | -7.00% | $3,484 |
Iron ore futures | 20.00% | -3.50% | $101.85 |
Source: Market Index
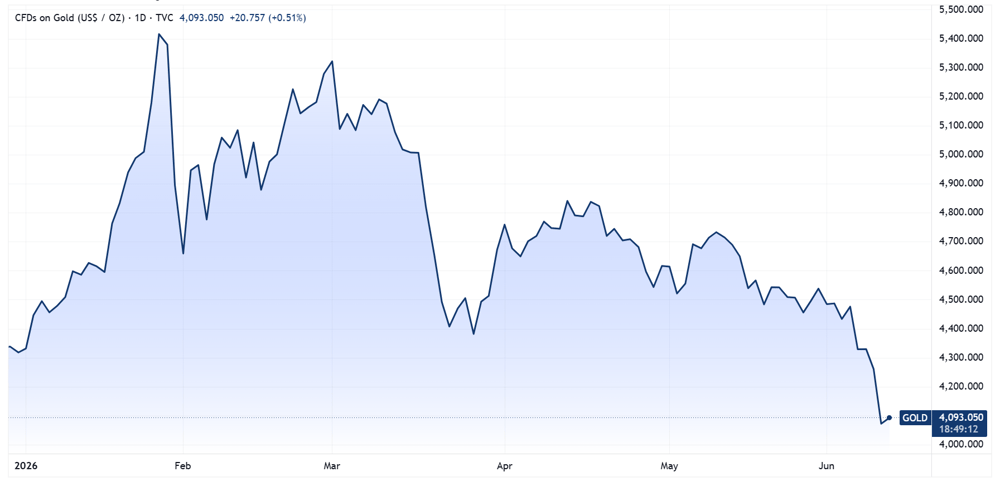
Gold price chart (Source: TradingView)
The selling appears to have subsided today, with the Materials Index bouncing off session lows of 2.7%, currently down just 0.50%. Most commodity prices have also started to bounce on Thursday, with gold up 1.0% and copper up 0.85% at the time of writing.
What's driving commodities lower
The commodities selloff has been driven by a broad range of catalysts, including:
Fed rate expectations have turned hawkish, with Thursday's May core CPI running at 2.9% year-on-year (highest since Sep-25) and headline at 4.2% (highest since Apr-23), markets are now pricing in a 25 bp Fed hike by December, with the possibility of two rate hikes, a clear negative for non-yielding USD-denominated commodities.
The US dollar is firmer on the hawkish rate repricing, with US Dollar Index is approaching the 100 level. The index has traded mostly sideways for the past year, mostly between 96 and 100, though recent upside pressures commodities.
US-Iran tensions are driving risk-off flows rather than a commodities bid, with a second day of US strikes near the Strait of Hormuz and Iranian retaliation against four US bases hitting global equity markets.
China demand backdrop is softening, with May CPI missing at 1.2% y/y vs 1.3% ests and core CPI easing to 1.1%, while PPI hit a four-year high of 3.9% on imported energy costs, a stagflationary mix that dents the bull case for the world's largest metals consumer.
Miners at a glance
Most large caps opened sharply lower this morning, but starting to bounce heading into afternoon trade. The average miner is down around 10% this week.
Ticker | Company | % Chg | Price | 1 Week % | YTD % |
|---|---|---|---|---|---|
BHP | BHP | 0.4% | $60.46 | -5.4% | 32.8% |
RIO | Rio Tinto | 0.2% | $179.74 | -5.4% | 22.4% |
FMG | Fortescue | -1.8% | $19.31 | -12.1% | -12.3% |
NST | Northern Star Resources | -0.9% | $18.38 | -12.5% | -25.2% |
AMC | Amcor | -1.2% | $54.71 | 2.4% | -12.5% |
EVN | Evolution Mining | 0.6% | $10.79 | -11.9% | -14.2% |
S32 | South32 | -1.9% | $4.40 | -9.2% | 23.8% |
JHX | James Hardie | -3.1% | $31.51 | -2.3% | 1.6% |
PLS | PLS Group | -1.0% | $5.71 | -11.0% | 35.8% |
LYC | Lynas Rare Earths | -2.6% | $16.43 | -14.9% | 32.4% |
Data as at 11:50 am AEST
Most gold names have also started to bounce off session lows. The below list features the ten largest gold miners by market cap, which are down an average 12.9% over the past week and down 23.6% year-to-date.
Ticker | Company | % Chg | Price | 1 Week % | YTD % |
|---|---|---|---|---|---|
NEM | Newmont | -3.3% | $132.75 | -11.8% | -11.6% |
NST | Northern Star Resources | -0.7% | $18.42 | -12.3% | -25.0% |
EVN | Evolution Mining | 0.4% | $10.78 | -12.0% | -14.3% |
PRU | Perseus Mining | -1.6% | $4.60 | -10.6% | -16.6% |
GMD | Genesis Minerals | -2.4% | $4.77 | -16.7% | -33.4% |
CMM | Capricorn Metals | -2.2% | $11.25 | -15.3% | -19.6% |
RMS | Ramelius Resources | 0.4% | $2.83 | -12.9% | -30.8% |
WGX | Westgold Resources | -0.8% | $4.49 | -12.2% | -28.8% |
RRL | Regis Resources | -0.5% | $5.55 | -11.9% | -26.2% |
VAU | Vault Minerals | 0.3% | $3.81 | -13.0% | -30.0% |
Data as at 11:52 am AEST
The high-flying lithium sector has also experienced a pronounced pullback, though most large caps (PLS, MIN) are still holding onto healthy year-to-date gains.
Ticker | Company | % Chg | Price | 1 Week % | YTD % |
|---|---|---|---|---|---|
PLS | PLS Group | -1.0% | $5.71 | -11.0% | 35.8% |
MIN | Mineral Resources | -1.5% | $63.24 | -12.8% | 16.3% |
IGO | IGO | -1.5% | $8.31 | -12.2% | 1.5% |
LTR | Liontown | -0.2% | $1.90 | -19.4% | 21.1% |
VUL | Vulcan Energy Resources | -1.1% | $3.12 | -17.8% | -29.4% |
PMT | PMET Resources | -2.3% | $0.55 | -28.5% | -8.1% |
CXO | Core Lithium | 2.1% | $0.25 | -16.9% | -10.9% |
Data as at 11:54 am AEST
Where to from here?
Commodities are caught in an awkward spot. The near-term catalysts driving this week's selloff, (hawkish Fed repricing, a firmer US dollar, US-Iran tensions and a softening China) are all pulling in the same direction, and that direction is down.
However, the bigger picture remains unchanged as factors like AI-driven capex, rising defence spending and a more fractured geopolitical backdrop are all feeding structural demand, and there is no supply response of any note to meet it.
Late last year, Morgan Stanley flagged the copper market heading into its largest deficit in more than two decades, around 590,000 tonnes, widening to 1.1 million tonnes by 2029. With so little new supply coming online, the setup feels rather asymmetric. That said, copper is still copper. It remains acutely sensitive to the ebb and flow of global industrial activity, the direction of the US dollar and shifts in sentiment. This is probably why we see the metal go from record highs last week, to a ~7% pullback just six days later.
The overall picture looks bullish, but with a sharp pullback across global equity markets, elevated geopolitical tensions and inflationary pressures all in play, volatility is very, very high right now.
