ASX 200 Materials sector surges 7.2% in best day since March 2020
The Materials Index just snapped a near-bear market with a 7.2% surge. The harder question is whether it sticks.

Source: iStock
Mentioned
KEY POINTS
- The Materials Index surged 7.2%, its best day since March 2020, as a Democratic midterm sweep sent Brent crude down 9% on Wednesday
- Gold miners led the charge, with the All Ords Gold Index up 11.95% as bullion rose 5.2% over two sessions, stoking talk the cycle low may be in
- Past rallies this size came out of crises and mostly delivered strong forward returns, but UBS found miners tend to lag once RBA rate hikes peak
The S&P/ASX 200 Materials Index (XMJ) jumped 7.2%, its best day since March 2020, after a Democratic sweep of the US midterm elections sparked a broad risk-on rally.
A one-day move of this magnitude is rare, and only comparable ones came during the pandemic, at the lows of the 2015-16 commodities downturn as China’s supercycle came to an end, and during the 2011 Eurozone sovereign debt crisis (more on that below).
The bounce follows a near-bear market for the sector, with the Materials Index down almost 20% from its 25 August record high on a mix of headwinds:
The US-Iran war that erupted in late February drove an energy price spike and tighter monetary policy, while higher diesel costs lifted miners’ unit costs. Brent hit US$117 a barrel just two weeks ago
Midterm uncertainty kept investors wary of cyclical exposure, with control of Congress and the policy agenda unclear until the results came in
AI infrastructure financing concerns intensified in mid-October, as high borrowing costs triggered a selloff in US tech stocks and their bonds
Risk appetite dried up, with bond yields only peaking in late September and the more speculative Small Ords and Emerging Companies indices down as much as 19% and 17% respectively by late October
Brent has tumbled 17% to US$93.70 over the past three days. That includes a 9.2% drop on Wednesday on bets a Democratic Congress will push for a quicker end to the war, which flows through to lower inflation expectations and bond yields. With the election uncertainty out of the way, Wall Street rallied broadly overnight, led by a 1,569-point or 3.0% surge in the Dow, its best day since April 2025.
Below, we unpack today’s key movers and where to from here.
A massive day for large cap miners
The table below shows the largest S&P/ASX 200 Materials names by market cap. Plenty are still down over the past month despite the rally, but today’s gains have pushed names like Rio Tinto, Northern Star, Evolution and Lynas back into positive territory for the year.
Ticker | Company | % Chg | Price | 1 Month | YTD |
|---|---|---|---|---|---|
BHP | BHP Group | 6.2% | $59.00 | -5.2% | 29.6% |
RIO | Rio Tinto | 7.0% | $153.04 | -8.7% | 4.2% |
FMG | Fortescue | 9.2% | $15.49 | -5.5% | -29.6% |
NST | Northern Star Resources | 9.9% | $25.94 | 8.5% | 5.6% |
EVN | Evolution Mining | 14.2% | $13.26 | 2.8% | 5.5% |
S32 | South32 | 6.6% | $4.55 | -8.8% | 28.2% |
BSL | Bluescope Steel | -1.8% | $31.90 | 1.8% | 32.5% |
LYC | Lynas Rare Earths | 8.0% | $12.95 | 2.0% | 4.4% |
SFR | Sandfire Resources | 6.8% | $20.29 | -9.0% | 13.0% |
MIN | Mineral Resources | 11.2% | $48.21 | -5.2% | -11.4% |
Data as at Thursday, 5 November 2026 close
Lithium stocks have been annihilated in recent weeks, after Chinese lithium carbonate futures more than halved from May highs of 209,880 yuan a tonne to around 86,000 yuan on Wednesday. They’re trading sharply higher today, but every name in the table is still down over the past month, and all bar Global Lithium are down for the year.
Ticker | Company | % Chg | Price | 1 Month | YTD |
|---|---|---|---|---|---|
VUL | Vulcan Energy | 18.2% | $1.24 | -26.7% | -72.0% |
LTR | Liontown | 11.7% | $0.67 | -18.3% | -57.3% |
MIN | Mineral Resources | 11.2% | $48.21 | -5.2% | -11.4% |
CXO | Core Lithium | 9.5% | $0.23 | -23.3% | -16.4% |
IGO | IGO | 8.9% | $5.27 | -18.2% | -35.7% |
PLS | PLS Group | 8.8% | $2.83 | -25.5% | -32.6% |
WC8 | Wildcat Resources | 7.5% | $0.22 | -20.4% | -41.9% |
DLI | Delta Lithium | 6.9% | $0.16 | -7.2% | -29.5% |
PMT | PMET Resources | 6.3% | $0.34 | -22.1% | -43.7% |
GL1 | Global Lithium Resources | 0.6% | $0.89 | -11.0% | 41.3% |
Data as at Thursday, 5 November 2026 close
Gold has struggled to find its groove since its brief US$5,598/oz peak on 29 January. Prices have mostly trended lower since then, hitting US$3,870/oz on 30 October. The Democratic sweep’s flow-on effect to oil prices, bond yields and liquidity conditions has some commentators suggesting gold is putting in a cycle low. Gold is still down 4.5% year-to-date, but it’s surged 5.2% over the last two sessions to US$4,136/oz. That made for a trigger-happy session for gold miners, with the All Ords Gold Index up 11.95%.
Ticker | Company | % Chg | Price | 1 Month | YTD |
|---|---|---|---|---|---|
PNR | Pantoro Gold | 18.5% | $3.27 | 12.4% | -33.3% |
CYL | Catalyst Metals | 18.3% | $4.13 | -26.6% | -44.0% |
GMD | Genesis Minerals | 15.4% | $7.33 | 3.7% | 2.4% |
OBM | Ora Banda Mining | 15.2% | $1.48 | 2.4% | -3.6% |
RSG | Resolute Mining | 14.7% | $1.25 | 9.6% | 2.0% |
WGX | Westgold Resources | 14.7% | $5.86 | 12.7% | -7.0% |
EVN | Evolution Mining | 14.2% | $13.26 | 2.8% | 5.5% |
MEK | Meeka Metals | 14.1% | $0.08 | -10.0% | -70.0% |
CMM | Capricorn Metals | 14.1% | $14.50 | 0.0% | 3.6% |
VAU | Vault Minerals | 13.7% | $6.05 | 1.7% | 11.2% |
RRL | Regis Resources | 13.2% | $6.87 | -3.9% | -8.6% |
NEM | Newmont | 13.0% | $174.39 | 5.1% | 16.2% |
ALK | Alkane Resources | 13.0% | $1.79 | -4.5% | 34.2% |
RMS | Ramelius Resources | 12.8% | $3.78 | -0.8% | -7.6% |
EMR | Emerald Resources | 12.5% | $6.82 | -1.3% | 8.6% |
BC8 | Black Cat Syndicate | 12.3% | $0.64 | -14.1% | -47.3% |
BGL | Bellevue Gold | 12.2% | $1.47 | -3.9% | -13.0% |
NST | Northern Star Resources | 9.9% | $25.94 | 8.5% | 5.6% |
PRU | Perseus Mining | 8.4% | $6.31 | 0.6% | 14.5% |
SBM | St Barbara | 8.1% | $0.81 | 3.9% | 40.0% |
AMI | Aurelia Metals | 5.1% | $0.42 | -5.7% | 69.4% |
Data as at Thursday, 5 November 2026 close
Copper miners also caught a broad bid, even though copper was flat on Wednesday and has barely moved today.
Ticker | Company | % Chg | Price | 1 Month | YTD |
|---|---|---|---|---|---|
FFM | Firefly Metals | 9.5% | $1.44 | -13.0% | -30.3% |
CBE | Cobre | 8.9% | $0.25 | -26.9% | 145.0% |
29M | 29Metals | 8.7% | $0.25 | -30.6% | -52.5% |
AR1 | Austral Resources Australia | 8.2% | $0.05 | -26.4% | -7.0% |
RIO | Rio Tinto | 7.0% | $153.04 | -8.7% | 4.2% |
SFR | Sandfire Resources | 6.8% | $20.29 | -9.0% | 13.0% |
S32 | South32 | 6.6% | $4.55 | -8.8% | 28.2% |
BHP | BHP Group | 6.2% | $59.00 | -5.2% | 29.6% |
CSC | Capstone Copper Corp | 5.5% | $11.67 | -20.1% | -23.0% |
KAN | Kantra Copper | 5.3% | $1.10 | -13.8% | 52.1% |
AIS | Aeris Resources | 5.3% | $0.40 | -15.8% | -33.3% |
CYM | Cyprium Metals | 5.2% | $0.31 | -33.0% | -42.4% |
HCH | Hot Chili | 2.3% | $1.31 | -15.5% | -5.8% |
MC2 | Marimaca Copper Corp | 1.5% | $6.84 | -18.1% | -45.3% |
Data as at Thursday, 5 November 2026 close
Where to from here?
The initial midterm reaction is all good news for commodities and broader equities. The US dollar has started to roll over, Brent is back below US$100 a barrel and the US 10-year yield is convincingly below 5.0%.
What's interesting is that copper has traded roughly flat since June, while the Global X Copper Miners ETF, a barometer for copper equities, has tumbled some 15%. So as risk appetite improves, some pockets of the market are having quite a knee-jerk reaction.
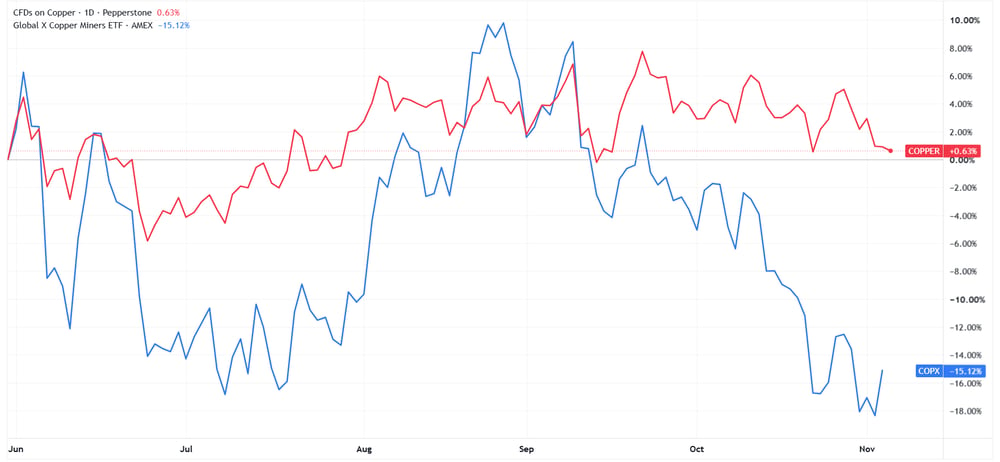
Copper price vs. Global X Copper Miners ETF | Source: TradingView
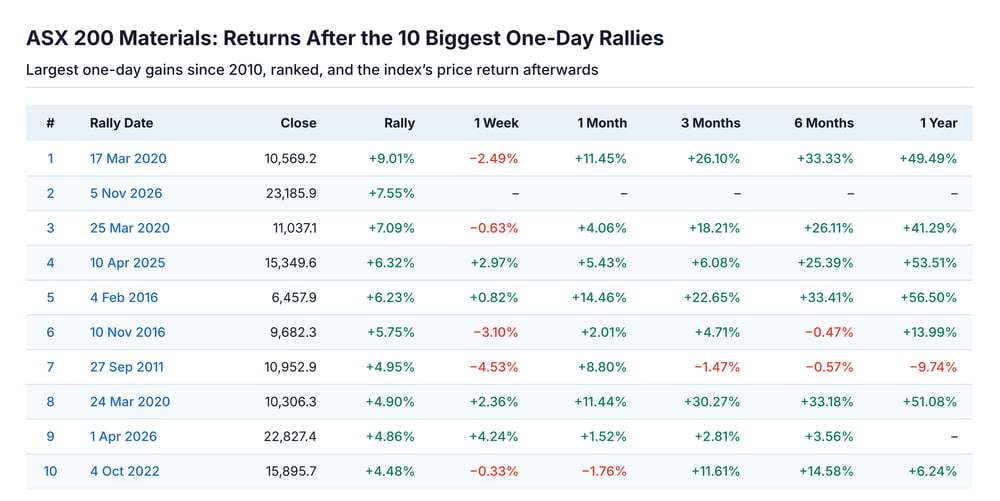
Today’s rally was the Materials Index’s largest since March 2020 and its second-largest one-day move since 2010. All of the prior big one-day rallies coincided with a crisis-like event. These included the pandemic, the April 2025 Trump tariff tantrum, the end of China’s supercycle (the Materials Index fell ~38% between March 2015 and January 2016) and the 2011 Eurozone sovereign debt crisis.
Coming off those crisis events, forward returns were overwhelmingly positive. The exception was September 2011, when miners never really bounced and the sector slid into China’s economic slowdown.
Source: Market Index
But we’re not in a crisis, are we?
In a separate note last week, UBS said the market may soon start looking past the hiking cycle. After the RBA’s dovish hike and the Democratic sweep, we’re pretty much there, with rates likely on hold for a long while.
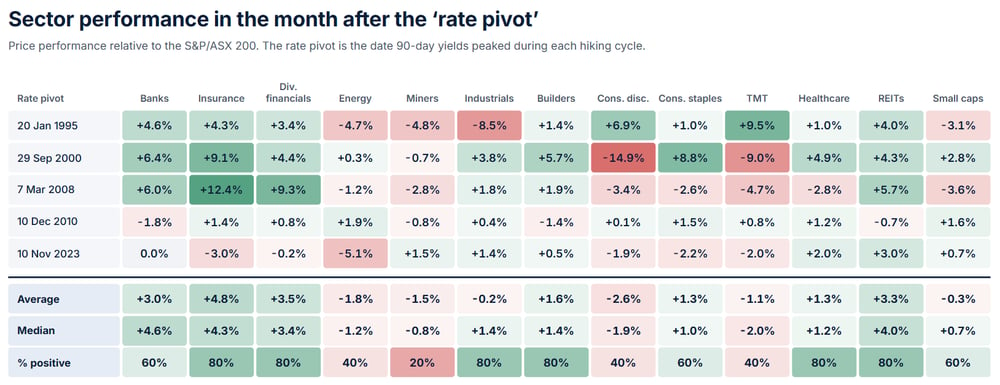
UBS looked at the last 35 years of RBA cycles and found that domestically focused sectors like banks, REITs and builders tend to bottom roughly three months before the final hike. The broker defines the ‘pivot’ as the point where 90-day bank bill yields peak during a hiking cycle. It has studied five since 1995: January 1995, September 2000, March 2008, December 2010 and November 2023.
Miners don’t actually do that well after these pivots.
Source: UBS, LSEG
There are a lot of moving pieces, but perhaps commodities just pick up where they left off before the US-Iran war. Back then, supply concerns were front and centre, the macro backdrop was still solid and the AI infrastructure buildout was supercharging demand. Either way, risk appetite is picking up at a time when some commodities have held up well and equities have been smashed, so some relief looks due.